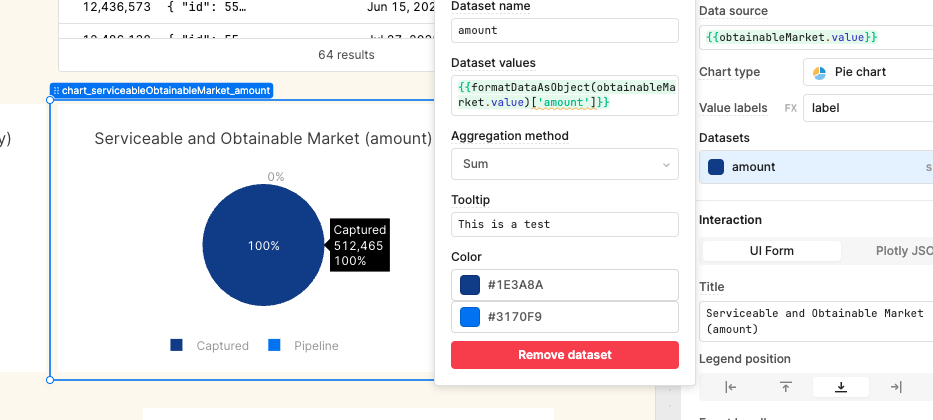
I'm trying to amend the tooltip of a Pie chart component, but it doesn't seem to be having any effect. I've tried with a Line Chart and it seems to work as expected, so it's just pie charts.
Here's a screenshot where I've amended the tooltip to 'This is a test' but it's still showing as the default template:
Hi @joelenfield, welcome to the forum!
Great question! Under the hood, Retool is setting Plotly's "hovertemplate" property to something like: "hovertemplate": "<b>%{x}</b><br>%{fullData.name}: %{y}<extra></extra>"
Here is the break down of how Plotly takes that syntax:
%{x}: This placeholder will be replaced with the x-value of the data point.
<b>%{x}</b><br>: This part creates a bolded label for the x-value and adds a line break (<br>).
%{fullData.name}: This placeholder is specific to Plotly, and it represents the name of the trace (line or bar) associated with the data point. %{fullData.name} will be replaced with the name of the trace.
%{y}: This part represents the y-value of the data point.
<extra></extra>: This is an empty container for any additional information you might want to include in the hover label.
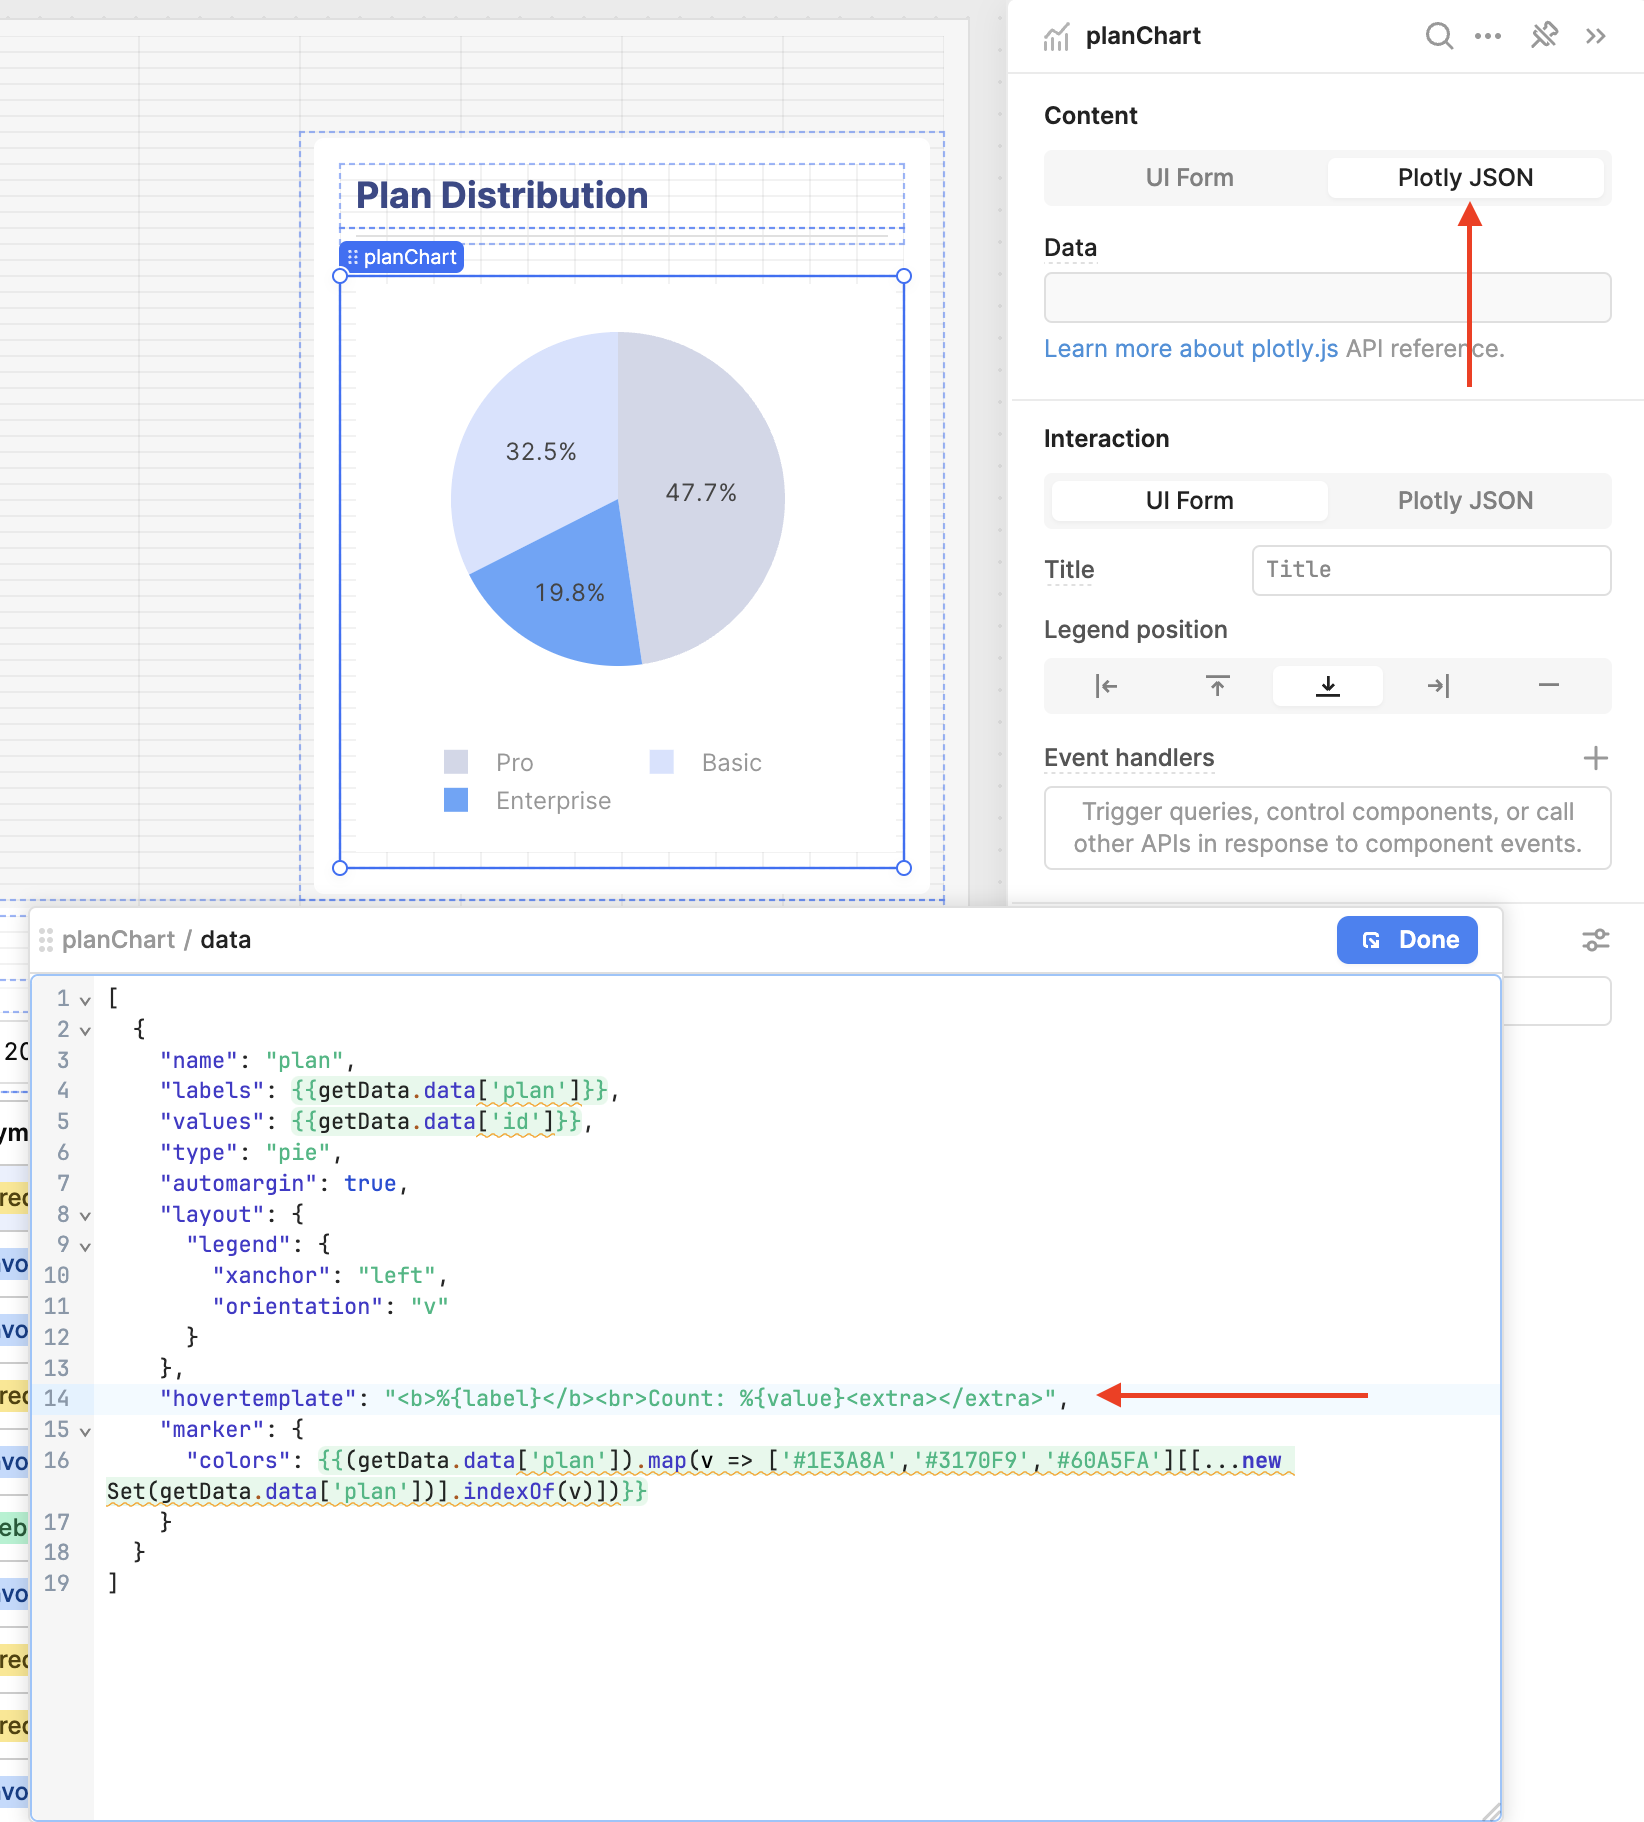
However, the syntax for a pie chart is different. Here is how the value for the "hovertemplate" property should look like for a pie chart:
%{label} is a placeholder for the label of the corresponding pie slice.
%{value} is a placeholder for the value associated with that slice.
Therefore, we need to change this manually. Instead of setting the "Content" using "UI Form", select "Plotly JSON" and add the latter value for the"hovertemplate" property: