Hello!
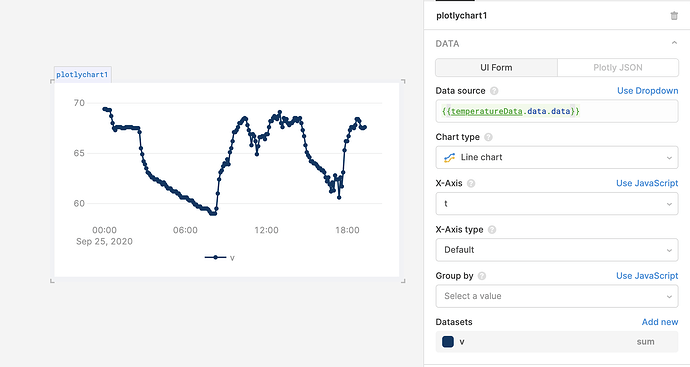
This is a great use case for the Plotly chart component. I've included a demo screenshot but the gist is you'll want to set {{QUERY_NAME.data.data}} as your datasource. The component pre-populates the rest of the fields with our best guess at x and y values. You can then edit the chart type, values, layout, etc.
Hope this helps!
