Hello,
I got a questions on creating charts. My question is how all the data will be shown by all X-axis data.
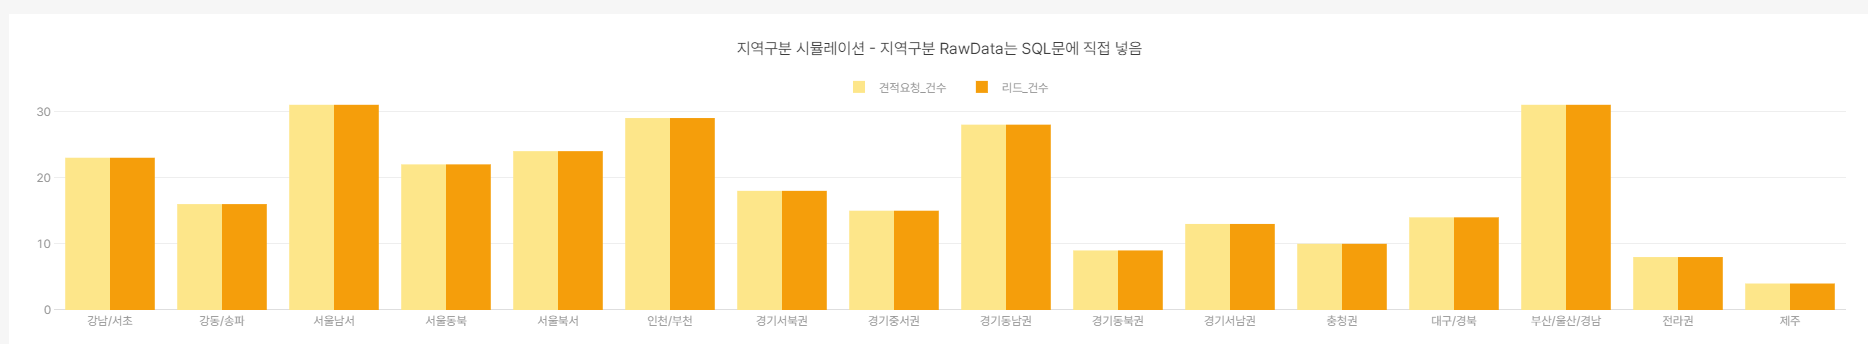
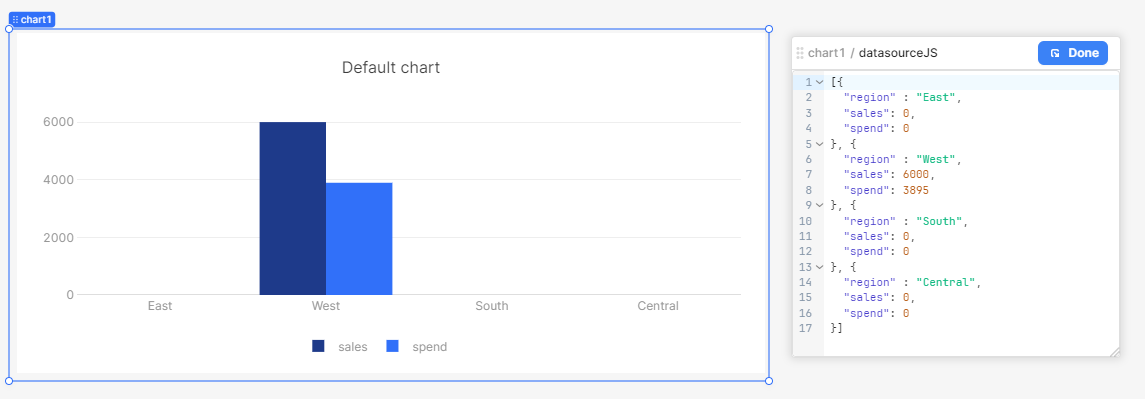
As you see the attached pics, I want to show my 2nd chart to look like 1st chart, in other word all X-axis fields should be shown and the height should be "0" when there is no data which is not corresponding to X-axis.
Thanks in advance,