Hello, looks like I am a noob and I am stuck. ![]() Nothing is populated on my Plotly graph. I'd appreciate any help!
Nothing is populated on my Plotly graph. I'd appreciate any help!
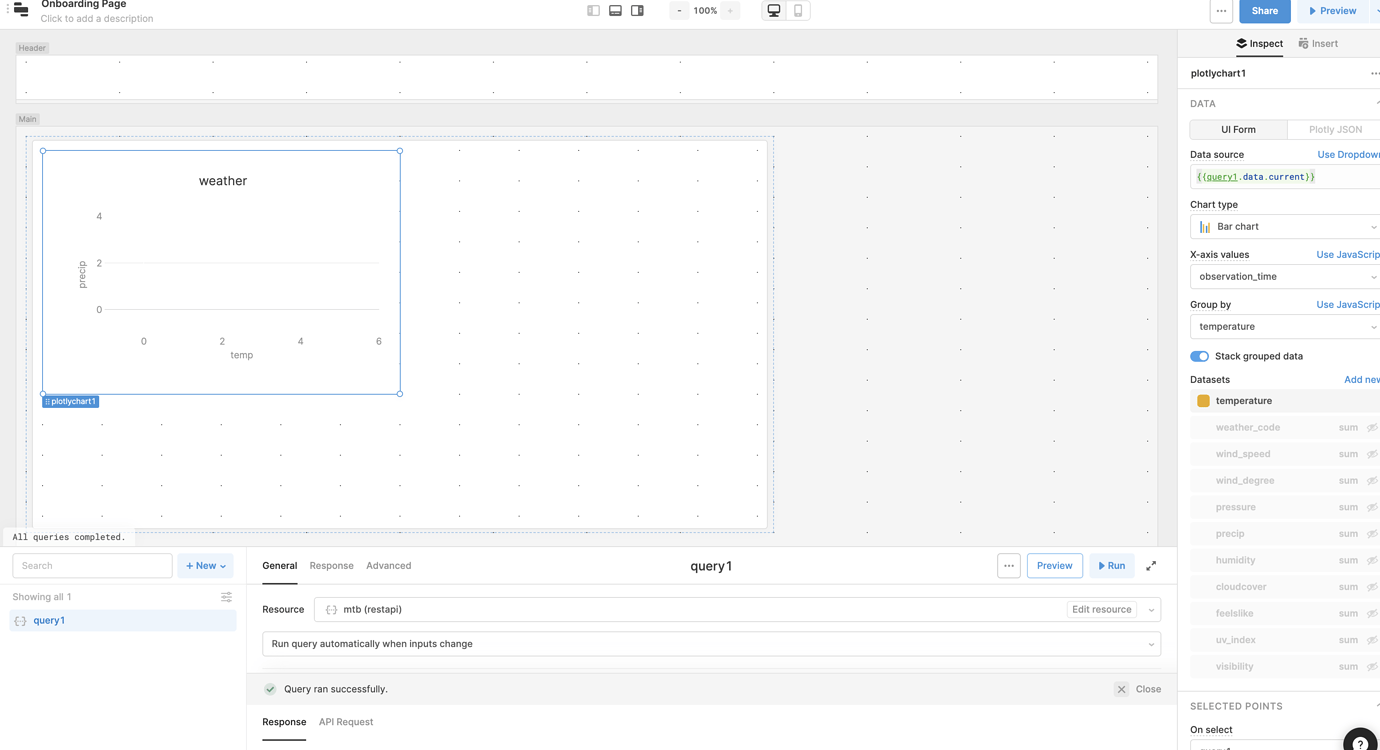
Here's my settings in Retool:
Here's my data:
{"request":{"type":"City","query":"London, United Kingdom","language":"en","unit":"m"},"location":{"name":"London","country":"United Kingdom","region":"City of London, Greater London","lat":"51.517","lon":"-0.106","timezone_id":"Europe\/London","localtime":"2021-05-07 18:48","localtime_epoch":1620413280,"utc_offset":"1.0"},"current":{"observation_time":"05:48 PM","temperature":13,"weather_code":113,"weather_icons":["https:\/\/assets.weatherstack.com\/images\/wsymbols01_png_64\/wsymbol_0001_sunny.png"],"weather_descriptions":["Sunny"],"wind_speed":15,"wind_degree":210,"wind_dir":"SSW","pressure":1016,"precip":0.4,"humidity":41,"cloudcover":0,"feelslike":12,"uv_index":3,"visibility":10,"is_day":"yes"}}