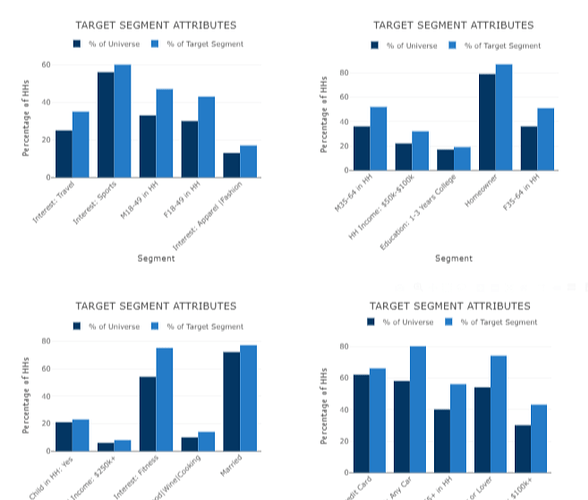
I have this custom component which works like charm the data is hard coded, I want to fetch the data from an SQL query results
The sql query has the columns
segment_name ( x axis ) , movie_count ( y-axis), standard _count (y-axis)
I am not able to figure how to feed the data to the iframe code section, i consider myself as beginner to retool, Can anyone clarify this? or redirect me to helpful docs?i checked the official documentation the instructions are not clear about model.
<script src="https://cdn.plot.ly/plotly-latest.min.js"></script>

<style>
  .row {
    display: flex;
    flex-wrap: wrap;
  }

  .col {
    flex: 50%;
  }

  .chart-container {
    margin-bottom: 20px;
  }
</style>

<div class="row">
  <div class="col" style="width: 50%;">
    <div id="chart1" class="chart-container"></div>
  </div>
  <div class="col" style="width: 50%;">
    <div id="chart2" class="chart-container"></div>
  </div>
</div>
<div class="row">
  <div class="col" style="width: 50%;">
    <div id="chart3" class="chart-container"></div>
  </div>
  <div class="col" style="width: 50%;">
    <div id="chart4" class="chart-container"></div>
  </div>
</div>

<script>
  var chartData = [
    {
      name: "% of Universe",
      x: ["Interest: Travel", "Interest: Sports", "M18-49 in HH", "F18-49 in HH", "Interest: Apparel |Fashion", "M35-64 in HH", "HH Income: $50k-$100k", "Education: 1-3 Years College", "Homeowner", "F35-64 in HH", "Child in HH: Yes ", "HH Income: $250k+", "Interest: Fitness", "Interest: Food|Wine|Cooking", "Married", "Any Credit Card", "In Market: Any Car", "A65+ in HH", "Pet Owner or Lover", "HH Income: $100k+"],
      y: ["25.0", "56.0", "33.0", "30.0", "13.0", "36.0", "22.0", "17.0", "79.0", "36.0", "21.0", "6.0", "54.0", "10.0", "72.0", "62.0", "58.0", "40.0", "54.0", "30.0"],
      type: 'bar',
      marker: { color: '#033663', size: 20 } // Increase the size value to adjust the width of the bars
    },
    {
      name: "% of Target Segment",
      x: ["Interest: Travel", "Interest: Sports", "M18-49 in HH", "F18-49 in HH", "Interest: Apparel |Fashion", "M35-64 in HH", "HH Income: $50k-$100k", "Education: 1-3 Years College", "Homeowner", "F35-64 in HH", "Child in HH: Yes ", "HH Income: $250k+", "Interest: Fitness", "Interest: Food|Wine|Cooking", "Married", "Any Credit Card", "In Market: Any Car", "A65+ in HH", "Pet Owner or Lover", "HH Income: $100k+"],
      y: ["35.0", "60.0", "47.0", "43.0", "17.0", "52.0", "32.0", "19.0", "87.0", "51.0", "23.0", "8.0", "75.0", "14.0", "77.0", "66.0", "80.0", "56.0", "74.0", "43.0"],
      type: 'bar',
      marker: { color: '#247BC7', size: 20 } // Increase the size value to adjust the width of the bars
    }
  ];

  var layout = {
    barmode: 'group',
    title: 'TARGET SEGMENT ATTRIBUTES',
    xaxis: {
      title: 'Segment',
      tickangle: -45,
      automargin: true
    },
    yaxis: {
      title: 'Percentage of HHs'
    },
    legend: {
      orientation: 'h',
      y: 1.2, // Adjust the y value to control the position of the legend
      xanchor: 'center',
      x: 0.5
    }
  };

  var subplotData1 = [
    {
      x: chartData[0].x.slice(0, 5),
      y: chartData[0].y.slice(0, 5),
      name: chartData[0].name,
      type: 'bar',
      marker: { color: '#033663', size: 20 } // Increase the size value to adjust the width of the bars
    },
    {
      x: chartData[1].x.slice(0, 5),
      y: chartData[1].y.slice(0, 5),
      name: chartData[1].name,
      type: 'bar',
      marker: { color: '#247BC7', size: 20 } // Increase the size value to adjust the width of the bars
    }
  ];

  var subplotData2 = [
    {
      x: chartData[0].x.slice(5, 10),
      y: chartData[0].y.slice(5, 10),
      name: chartData[0].name,
      type: 'bar',
      marker: { color: '#033663', size: 20 } // Increase the size value to adjust the width of the bars
    },
    {
      x: chartData[1].x.slice(5, 10),
      y: chartData[1].y.slice(5, 10),
      name: chartData[1].name,
      type: 'bar',
      marker: { color: '#247BC7', size: 20 } // Increase the size value to adjust the width of the bars
    }
  ];

  var subplotData3 = [
    {
      x: chartData[0].x.slice(10, 15),
      y: chartData[0].y.slice(10, 15),
      name: chartData[0].name,
      type: 'bar',
      marker: { color: '#033663', size: 20 } // Increase the size value to adjust the width of the bars
    },
    {
      x: chartData[1].x.slice(10, 15),
      y: chartData[1].y.slice(10, 15),
      name: chartData[1].name,
      type: 'bar',
      marker: { color: '#247BC7', size: 20 } // Increase the size value to adjust the width of the bars
    }
  ];

  var subplotData4 = [
    {
      x: chartData[0].x.slice(15, 20),
      y: chartData[0].y.slice(15, 20),
      name: chartData[0].name,
      type: 'bar',
      marker: { color: '#033663', size: 20 } // Increase the size value to adjust the width of the bars
    },
    {
      x: chartData[1].x.slice(15, 20),
      y: chartData[1].y.slice(15, 20),
      name: chartData[1].name,
      type: 'bar',
      marker: { color: '#247BC7', size: 20 } // Increase the size value to adjust the width of the bars
    }
  ];

  Plotly.newPlot('chart1', subplotData1, layout);
  Plotly.newPlot('chart2', subplot
  Plotly.newPlot('chart3', subplotData3, layout);
  Plotly.newPlot('chart4', subplotData4, layout);
</script>
