
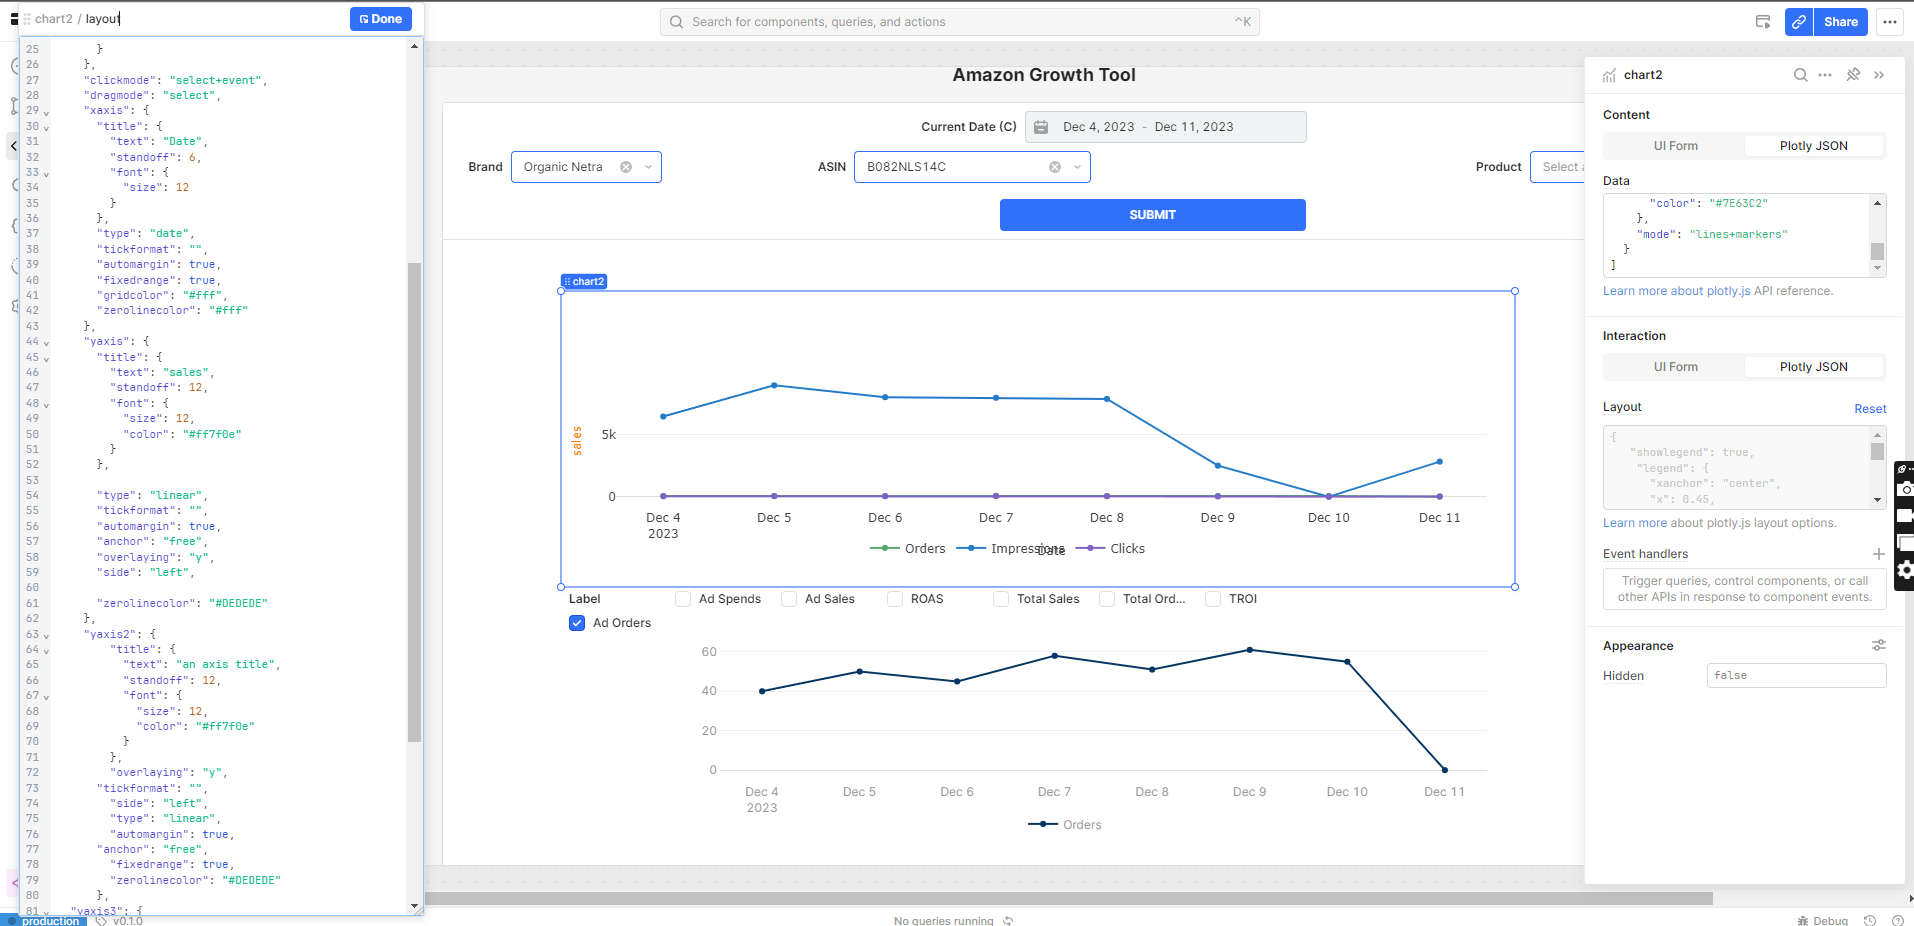
I want to create like this so using checkbox I can toggle which graph I want to see and how to create multiple scale on y axis.
Any help will be appreciated.
basicly the chart component of retool is based on plotly and you could use every option with PLOTLY json within the component.
see also: Multiple axes in JavaScript
Hey Thomas, Thank you for assistance. I tried using plotlyjs but don't know where I'm going wrong. can you help me with this.
{
   "showlegend": true,
    "legend": {
      "xanchor": "center",
      "x": 0.45,
      "y": -0.2,
      "orientation": "h",
      "width":800
    },
    "margin": {
      "l": 16,
      "r": 24,
      "t": 80,
      "b": 72,
      "pad": 2
    },
    "hovermode": "closest",
    "hoverlabel": {
      "bgcolor": "#000",
      "bordercolor": "#000",
      "font": {
        "color": "#fff",
        "family": "var(--default-font, var(--sans-serif))",
        "size": 12
      }
    },
    "clickmode": "select+event",
    "dragmode": "select",
    "xaxis": {
      "title": {
        "text": "Date",
        "standoff": 6,
        "font": {
          "size": 12
        }
      },
      "type": "date",
      "tickformat": "",
      "automargin": true,
      "fixedrange": true,
      "gridcolor": "#fff",
      "zerolinecolor": "#fff"
    },
    "yaxis": {
      "title": {
        "text": "sales",
        "standoff": 12,
        "font": {
          "size": 12,
          "color": "#ff7f0e"
        }
      },

      "type": "linear",
      "tickformat": "",
      "automargin": true,
      "anchor": "free",
      "overlaying": "y",
      "side": "left",

      "zerolinecolor": "#DEDEDE"
    },
    "yaxis2": {
        "title": {
          "text": "an axis title",
          "standoff": 12,
          "font": {
            "size": 12,
            "color": "#ff7f0e"
          }
        },
        "overlaying": "y",
      "tickformat": "",
        "side": "left",
        "type": "linear",
        "automargin": true,
      "anchor": "free",
        "fixedrange": true,
        "zerolinecolor": "#DEDEDE"
      },
  "yaxis3": {
        "title": {
          "text": "yaxis3 title",
          "standoff": 12,
          "font": {
            "size": 12,
            "color": "#ff7f0e"
          }
        },
        "overlaying": "y",
      "tickformat": "",
        "side": "right",
        "type": "linear",
        "automargin": true,
      "anchor": "free",
        "fixedrange": true,
        "zerolinecolor": "#DEDEDE"
      }
  }
i could not digg in deep, but first try it to make it work with 2 yaxis.
yaxis.overlaying = "y" looks strange for me and when i kill it then a second line is shown.
yaxis2.side should be right for better readability and also in styling possibilities for my opinion.
but to be honest i also using retool and plotly since 2 weeks ![]()
Hey I figured it out.

for DATA Field
[
  {
    "name": "Orders",
    "x": {{Overall.data['date']}},
    "y": {{Overall.data.orders}},
    "type": "line",
    "transforms": [
      {
        "type": "sort",
        "target": {{Overall.data['date']}},
        "order": "ascending"
      },
      {
        "type": "aggregate",
        "groups": {{Overall.data['date']}},
        "aggregations": [
          {
            "target": "y",
            "func": "sum",
            "enabled": true
          }
        ]
      }
    ],
    "marker": {
      "color": "#238146"
    },
    "mode": "lines+markers"
  },
  {
    "name": "Impressions",
    "x": {{Overall.data['date']}},
    "y": {{Overall.data.impressions}},
     "yaxis": 'y2',
    "type": "line",
    "transforms": [
      {
        "type": "sort",
        "target": {{Overall.data['date']}},
        "order": "ascending"
      },
      {
        "type": "aggregate",
        "groups": {{Overall.data['date']}},
        "aggregations": [
          {
            "target": "y",
            "func": "sum",
            "enabled": true
          }
        ]
      }
    ],
    "marker": {
      "color": "#247BC7"
    },
    "mode": "lines+markers"
  },
  {
    "name": "Clicks",
    "x": {{Overall.data['date']}},
    "y": {{Overall.data.clicks}},
    "type": "line",
    "yaxis": 'y3',
    "transforms": [
      {
        "type": "sort",
        "target": {{Overall.data['date']}},
        "order": "ascending"
      },
      {
        "type": "aggregate",
        "groups": {{Overall.data['date']}},
        "aggregations": [
          {
            "target": "y",
            "func": "sum",
            "enabled": true
          }
        ]
      }
    ],
    "marker": {
      "color": "#7E63C2"
    },
    "mode": "lines+markers"
  },
  {
    "name": "TROI",
    "x": {{Overall.data['date']}},
    "y": {{ Overall.data.troi }},
    "yaxis": 'y4',
    "type": "line",
    "transforms": [
      {
        "type": "sort",
        "target": {{Overall.data['date']}},
        "order": "ascending"
      },
      {
        "type": "aggregate",
        "groups": {{Overall.data['date']}},
        "aggregations": [
          {
            "target": "y",
            "func": "sum",
            "enabled": true
          }
        ]
      }
    ],
    "marker": {
      "color": "#C15627"
    },
    "mode": "lines+markers"
  },
  {
    "name": "Sales",
    "x": {{Overall.data['date']}},
    "y": {{ Overall.data.sales }},
    "yaxis": 'y5',
    "type": "line",
    "transforms": [
      {
        "type": "sort",
        "target": {{Overall.data['date']}},
        "order": "ascending"
      },
      {
        "type": "aggregate",
        "groups": {{Overall.data['date']}},
        "aggregations": [
          {
            "target": "y",
            "func": "sum",
            "enabled": true
          }
        ]
      }
    ],
    "marker": {
      "color": "#643125"
    },
    "mode": "lines+markers"
  },
  {
    "name": "Sales",
    "x": {{Overall.data['date']}},
    "y": {{ Overall.data.pv }},
    "yaxis": 'y6',
    "type": "line",
    "transforms": [
      {
        "type": "sort",
        "target": {{Overall.data['date']}},
        "order": "ascending"
      },
      {
        "type": "aggregate",
        "groups": {{Overall.data['date']}},
        "aggregations": [
          {
            "target": "y",
            "func": "sum",
            "enabled": true
          }
        ]
      }
    ],
    "marker": {
      "color": "#C509EF"
    },
    "mode": "lines+markers"
  }
]
for Layout field
{
  "showlegend": true,
  "legend": {
    "xanchor": "center",
    "x": 0.5,
    "y": 1.19,
    "orientation": "h",
    "width":100,
    "height":800,
  },
  "margin": {
    "l": 100,
    "r": 50,
    "t": 80,
    "b": 5,
    "pad": 20,
  },
  "hovermode": "closest",
  "hoverlabel": {
    "bgcolor": "#000",
    "bordercolor": "#000",
    "font": {
      "color": "#fff",
      "family": "var(--default-font, var(--sans-serif))",
      "size": 12
    }
  },
  "clickmode": "select+event",
  "dragmode": "select",
  "xaxis": {
    "title": {
      "text": "Date",
      "standoff": 1,
      "font": {
        "size": 13
      }
    },
    "tickmode": "auto",
    "type": "date",
   "domain": [0.14, 0.8],
    "automargin": true,

    "gridcolor": "#fff",
    "zerolinecolor": "#fff",
    "position":0.03
  },
  "yaxis": {
    "title": {
      "text": "Orders",
      "standoff": 2,
      "font": {
        "size": 14,
        "color": "#238146"
      }
    },
     "tickfont": {"color": "#238146"},
    "type": "linear",

  },
  "yaxis2": {
    "title": {
      "text": "Impressions",
      "standoff": 0.5,
      "font": {
        "size": 14,
        "color": "#247BC7",
      }
    },
    "tickfont": {"color": "#247BC7"},
    "anchor": "free",
    "overlaying": "y",
    "side": "left",
   "position": 0.054
  },
  "yaxis3": {
    "title": {
      "text": "Clicks",
      "standoff": 12,
      "font": {
        "size": 14,
        "color": "#7E63C2"
      }
    },
    "tickfont": {"color": "#7E63C2"},
    "anchor": "free",
    "overlaying": "y",
    "side": "right",
    "type": "linear",
    "position": 0.83


  },
   "yaxis4": {
    "title": {
      "text": "TROI",
      "standoff": 2,
      "font": {
        "size": 14,
        "color": "#C15627"
      }
    },
    "tickfont": {"color": "#C15627"},
    "anchor": "free",
    "overlaying": "y",
    "side": "right",
    "position": 0.95

  },
   "yaxis5": {
    "title": {
      "text": "Sales",
      "standoff": 2,
      "font": {
        "size": 14,
        "color": "#643125"
      }
    },
    "tickfont": {"color": "#643125"},
    "anchor": "free",
    "overlaying": "y",
    "side": "right",
    "position": 0.89

  }
  ,
   "yaxis6": {
    "title": {
      "text": "PV",
      "standoff": 2,
      "font": {
        "size": 14,
        "color": "#C509EF"
      }
    },
    "tickfont": {"color": "#C509EF"},
    "anchor": "free",
    "overlaying": "y",
    "side": "left",
    "position": 0.81

  }
}
3 Likes