Step-by-Step Implementation
1. Create Your Agent Tool
Configure your AI Agent with a tool that accepts Plotly JSON format. Example tool definition
// Tool name: showGraph // Parameters: { "GraphPlotly": { "data": [...], // Plotly data array "layout": {...} // Plotly layout object } }
2. Create a Transformer to Extract Graph Data
Create a transformer called getGraphPlotly with this code
function getLastGraphPlotlyData() {
const tryParse = (v) => {
if (!v) return undefined;
if (typeof v === 'string') {
try {return JSON.parse(v);} catch (_) {return undefined;}
}
return v && typeof v === 'object' ? v : undefined;
};
const extractDataAndLayout = (t) => {
let p = t?.toolData?.toolParameters;
// Data a layout jsou v toolParameters.GraphPlotly if (p?.GraphPlotly !== undefined) { const graphPlotly = p.GraphPlotly; let data = graphPlotly.data; let layout = graphPlotly.layout; // Pokud je data string, parsuj to if (typeof data === 'string') { data = tryParse(data); } // Pokud je layout string, parsuj to if (typeof layout === 'string') { layout = tryParse(layout); } return { data, layout }; } return { data: undefined, layout: undefined };
};
const candidates = ;
const considerTrace = (t) => {
if (!t || typeof t !== 'object') return;
// Hledáme TOOL_END s nástrojem "showGraph" const isToolEnd = t?.spanType === 'TOOL_END'; const isShowGraph = t?.toolData?.toolName === 'showGraph'; if (!isToolEnd || !isShowGraph) return; const { data, layout } = extractDataAndLayout(t); if (data === undefined) return; const ts = typeof t.timestamp === 'number' ? t.timestamp : null; candidates.push({ ts, data, layout });
};
const invoke = {{ agentChat1_query1 }};
const t1 = Array.isArray(invoke?.data?.trace) ? invoke.data.trace : ;
t1.forEach(considerTrace);
const agent = {{ agentChat1 }};
const msgs = Array.isArray(agent?.messages) ? agent.messages : ;
msgs.forEach((m) => {
const tr = Array.isArray(m?.runData?.trace) ? m.runData.trace : ;
tr.forEach(considerTrace);
});
if (!candidates.length) {
// Nenašlo se: [false, null, null]
return [false, null, null];
}
// Najdi poslední podle timestamp
const withTs = candidates.filter((c) => typeof c.ts === 'number');
let result;
if (withTs.length) {
withTs.sort((a, b) => a.ts - b.ts);
result = withTs[withTs.length - 1];
} else {
result = candidates[candidates.length - 1];
}
// Vrať: [true, data, layout]
return [true, result.data ?? , result.layout ?? {}];
}
return getLastGraphPlotlyData();
Important: Replace agentChat1 and agentChat1_query1 with your actual Agent Chat component IDs, and showGraph with your tool name.
3. Add a Plotly Chart Component
Add a Mixed Chart component and configure it:
-
Chart type:
plotlyJson -
Data:
{{ getGraphPlotly.value[1] }} -
Layout:
{{ getGraphPlotly.value[2] }} -
Hidden:
{{ !getGraphPlotly.value[0] }}(optional - hides chart when no graph exists)
How It Works
-
User asks agent: "Plot the equation y = x/2 for x from 1 to 5"
-
Agent generates data and calls the
showGraphtool with Plotly JSON -
Transformer monitors the agent's trace logs
-
Finds the latest
TOOL_ENDspan wheretoolName === 'showGraph' -
Extracts
toolParameters.GraphPlotly.dataandtoolParameters.GraphPlotly.layout -
Returns array:
[true, data, layout] -
Chart component automatically updates with the new graph!
Return Format
The transformer returns an array
[found, data, layout]
-
found(boolean):trueif a graph was found,falseotherwise -
data(array): Plotly data array -
layout(object): Plotly layout object
Usage:
-
{{ getGraphPlotly.value[0] }}→ true/false -
{{ getGraphPlotly.value[1] }}→ graph data -
{{ getGraphPlotly.value[2] }}→ graph layout
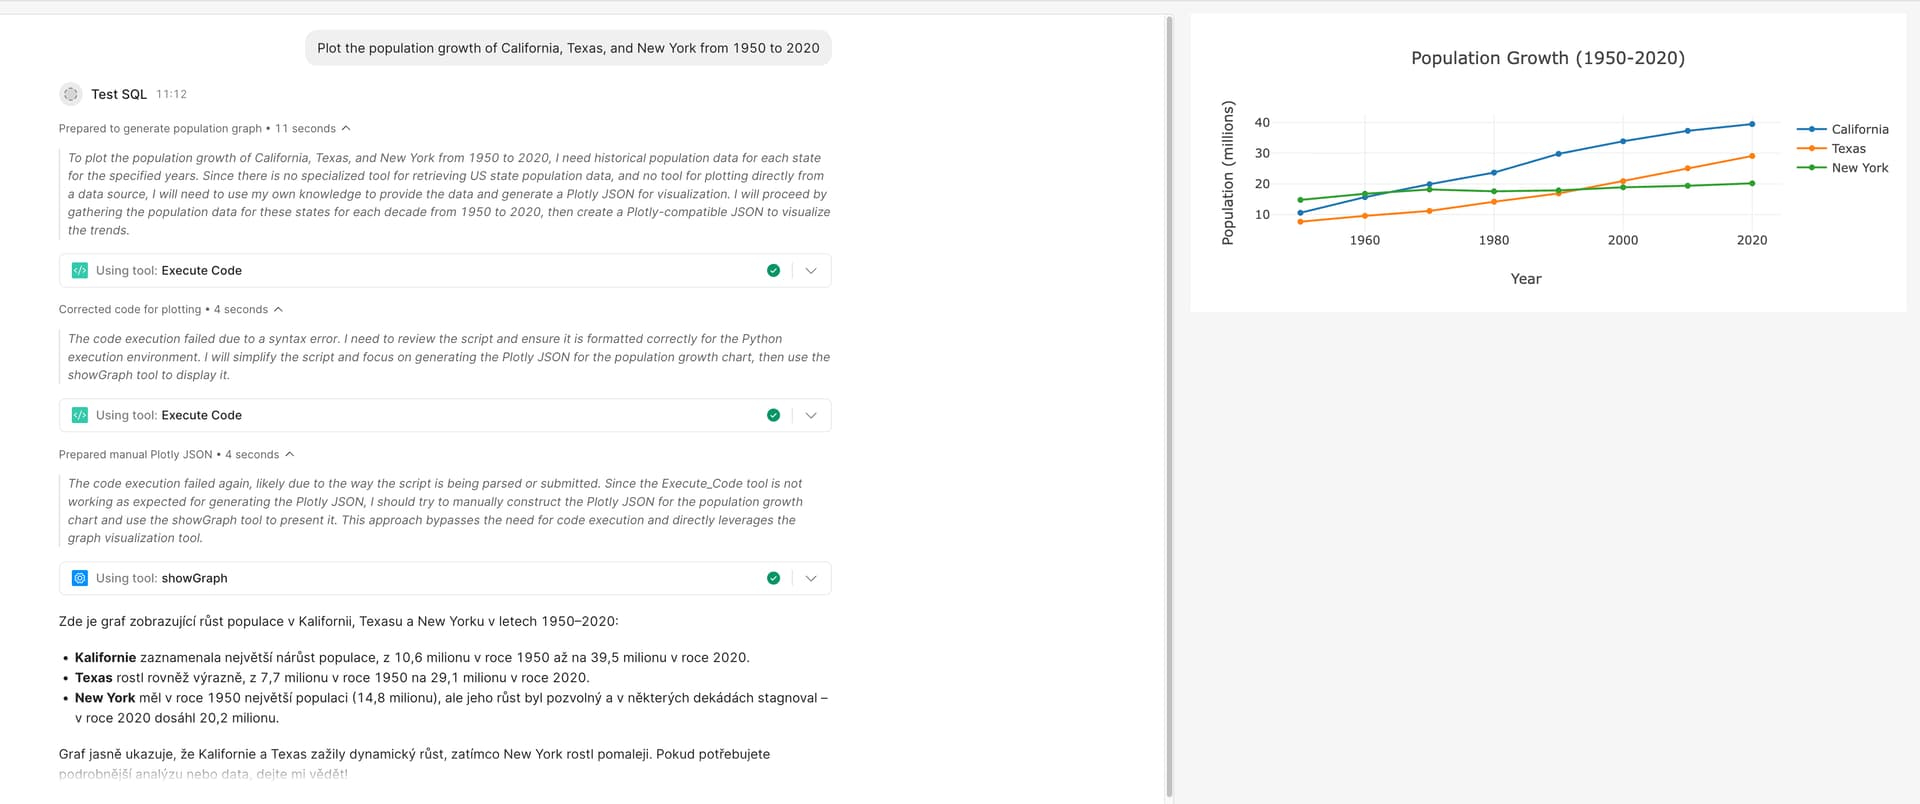
Result
![]() Users see real interactive Plotly graphs instead of just text responses
Users see real interactive Plotly graphs instead of just text responses
![]() Graphs automatically update when the agent creates new visualizations
Graphs automatically update when the agent creates new visualizations
![]() Chart is hidden when no graph exists
Chart is hidden when no graph exists
Customization Tips
-
Different tool name? Change
'showGraph'in the transformer to match your tool -
Different parameter structure? Adjust the
extractDataAndLayoutfunction -
Multiple agents? Create separate transformers for each agent or parameterize the agent ID
Happy graphing! ![]()