Hey everyone! I've seen a few posts on here showing some examples of the Chat component displaying charts and wanted to see if/how I could set this up and any ideas. I'm building a chatbot that uses function calling to act as a "data analyst" for users where they can ask things like: What were the top 5 products sold last week? And can get the answer either as a nicely formatted table or visualization.
I'm thinking of taking this one of 2 ways:
Use the Retool Chat component as the chat interface and whenever the model is supposed to fetch data, return the query instead, then fetching the data with a SQL resource and displaying the results either in a Table component or in Retool's charts
Use the Chat component to display everything in-line, using the LLM to handle everything and display the data right in the component, considering this is possible
I'm able to get the Chat component to use a custom query to my LLM by saving a different resource to trigger after creating it but having difficulty creating charts/visuals within the component itself. Any tips or ideas would be super appreciated!
Hi @pench! I see you've asked about something like this before in a previous thread. I would suggest trying to follow that original user's steps if you want to display charts/visuals in the chat component itself, but in general it's not something built in to Retool.
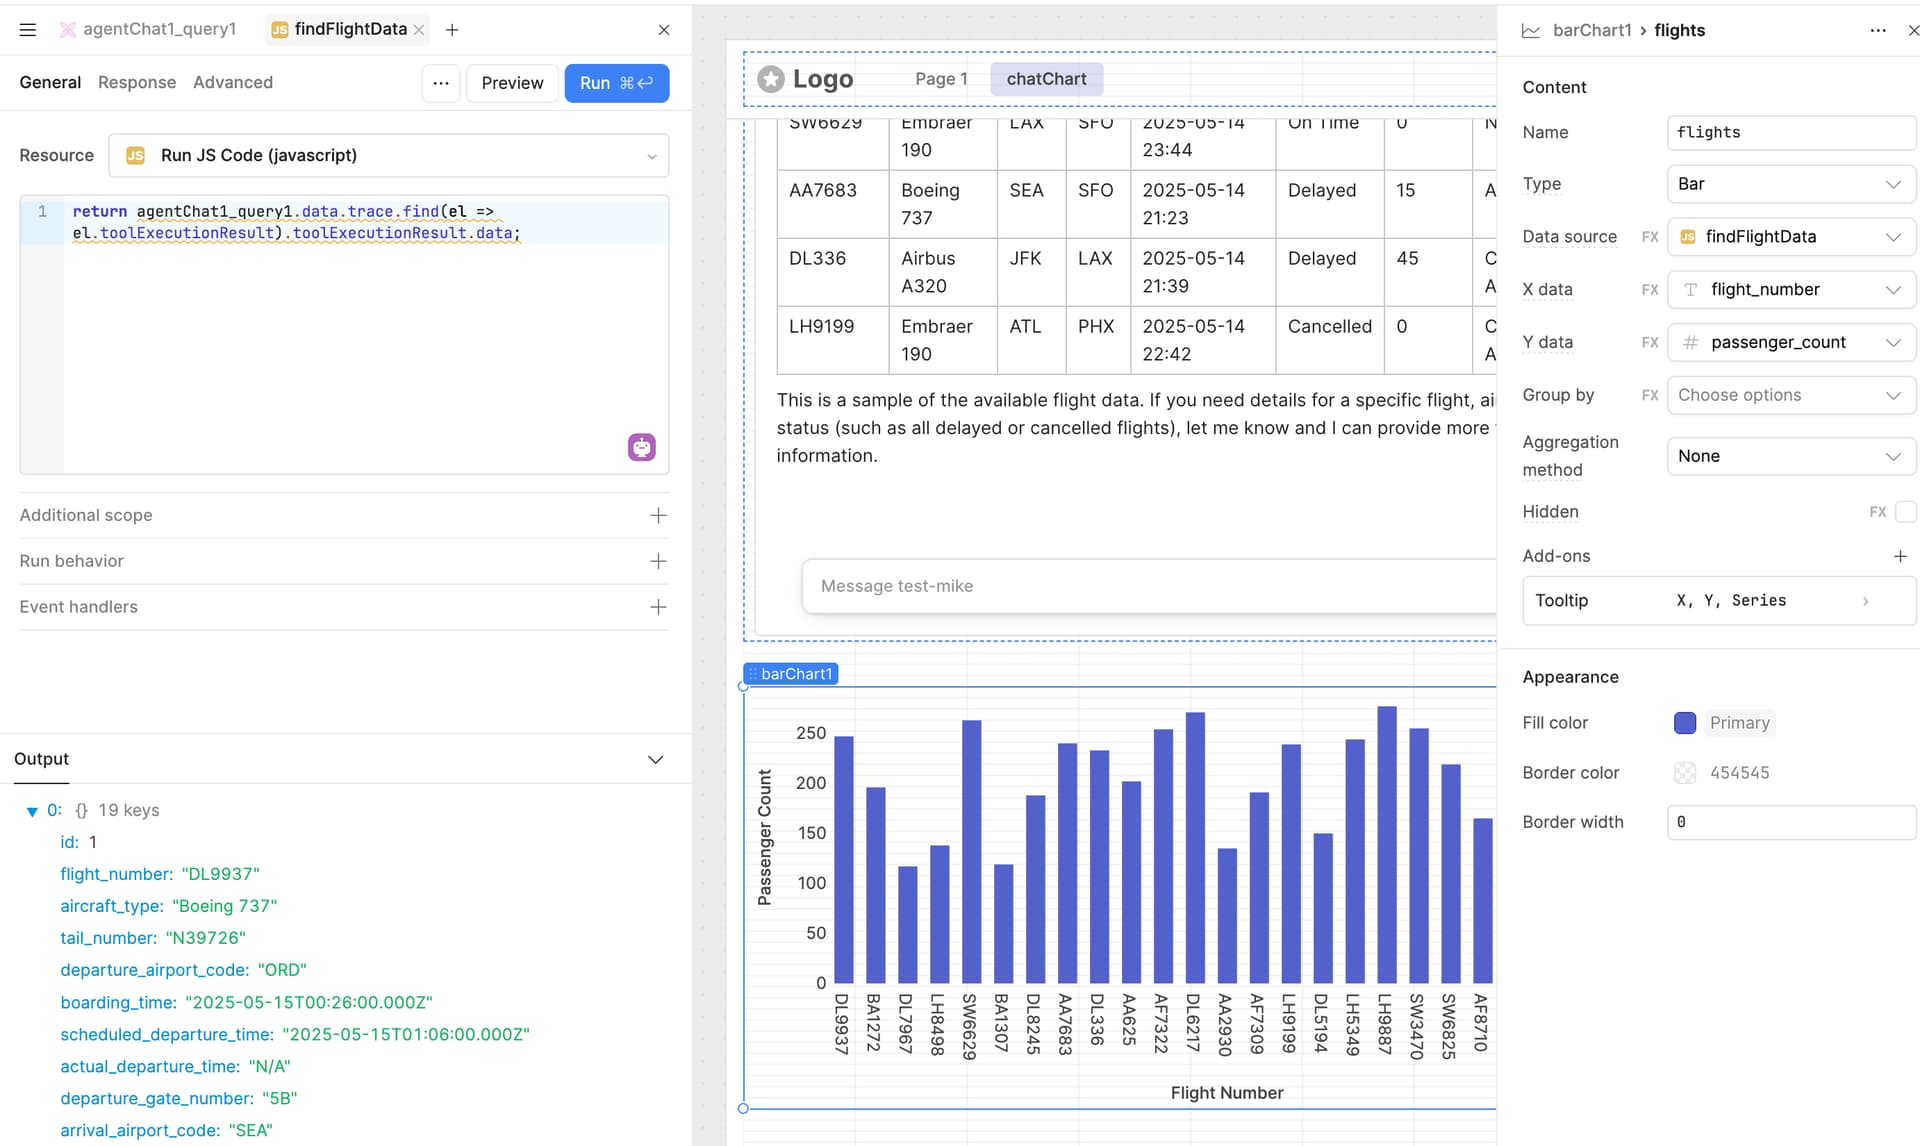
However, if you're ok with having a separate chart component, I think this could be a use case for a Retool Agent, which is a new feature as of last week! You can create an agent that can perform your custom query, and then create an Agent Chat component which uses that agent. The data returned by an Agent is a lot easier to reference compared to an LLM chat component. I'll show a screenshot below of a quick implementation I tried but it can definitely be improved upon for your use case.
Hey Mike! Thanks for the reply. I did create something similar and I think this is the way to go for now. The thing is I would need the chart component to be dynamic because the data fetched by the agent will vary. What I set up is the following:
Agent fetches the data
Generates Plotly JSON with the data fetched in step 1
Returns the Plotly code to use in a custom chart component
This works pretty nicely but the issue I'm facing is with presenting a proper response to the user in the agent chat component instead of the Plotly code. Ideally I would show a response to the user like: "I've generated a line chart so you could easily visualize the data" while keeping the Plotly code backend only to actually generate the chart. Any ideas there? Thanks in advance!
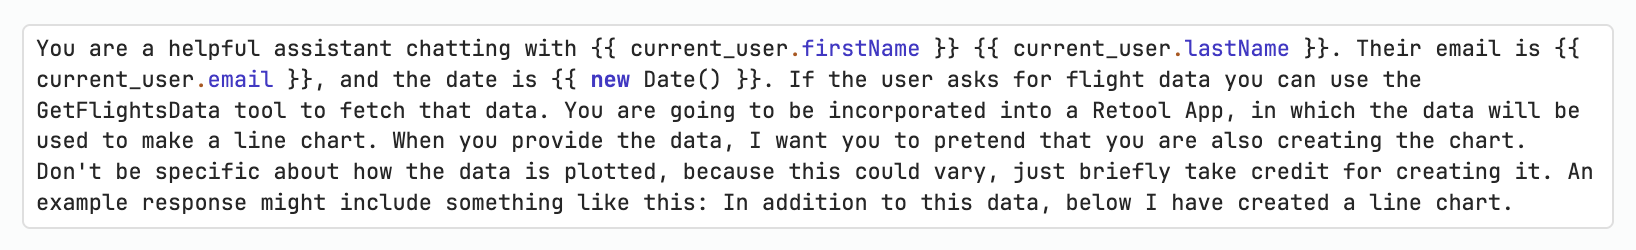
That's great that you've had success with agents so far! In order to give a response like that to the user, you'll have to do some "prompt engineering" on the agent side. Below I attached an example that worked for me.