- Goal: I want to have a scatterplot with 2 axis, both having numeric values. I am showing the entities in the plot, which have a label called entity_name. This entity_name is shown, as well as the marker. I am using the plotly JSON, since this is an advanced usecase that is not possible with the UI form. -->
Here is a screenshot of what the plot looks like now:
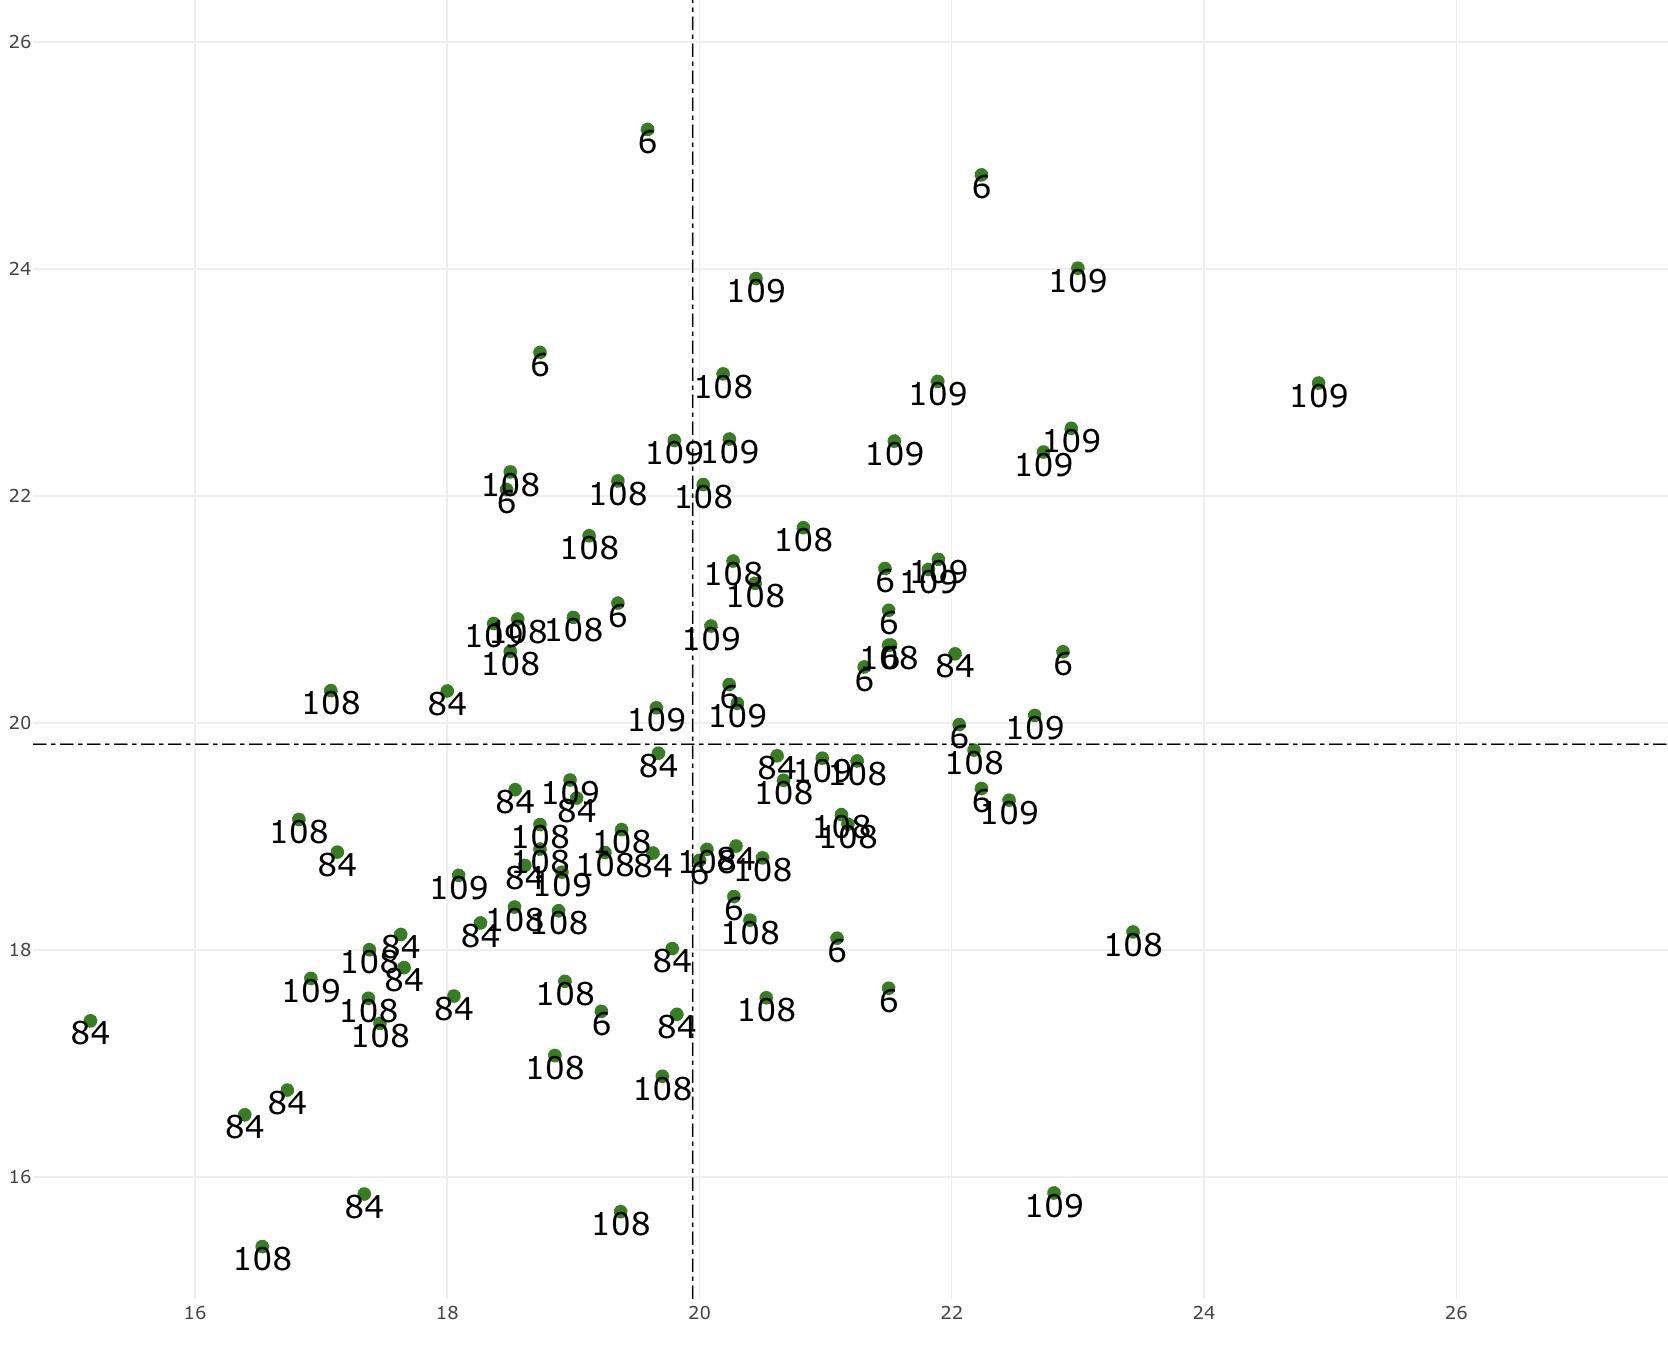
As you can see, once there are maybe observations, some of the entity_types become unreadable, so I would like to hide those. I have hovering enabled anyway, so the user could get information about those observations. But I still want to show the text for observations where it is possible.
Here is the data part for the plotly JSON that builds the chart.
[
    {
      "name": "Scatter Plot",
      "x": {{ all_data.data[select1.value].map(Number) }},
      "y": {{ all_data.data[select2.value].map(Number) }},
      "type": "scatter",
      "mode": "markers",
      "hovertemplate": "<br>%{text}",
      "transforms": [
        {
          "type": "groupby",
          "groups": {{all_data.data['entity_type']}},
          "styles": [
            {
              "target": "{{_.uniq(all_data.data['league_name'])[0]}}",
              "value": {
                "marker": {
                  "color": "#8B0000"
                }
              }
            },
            {
              "target": "{{_.uniq(all_data.data['league_name'])[1]}}",
              "value": {
                "marker": {
                  "color": "#FFD700"
                }
              }
            },
            {
                "target": "{{_.uniq(all_data.data['league_name'])[0]}}",
                "value": {
                  "marker": {
                    "color": "#00008B"
                  }
                }
              },
            // Add more styles for additional unique league names if needed
          ]
        }
      ],
      "text": {{ all_data.data['entity_type'] }},
      "marker": {
        "color": "green",
        "size": 9
    }
    },
    {
      "type": "scatter",
      "x": {{ all_data.data[select1.value].map(Number) }},
      "y": {{ all_data.data[select2.value].map(Number) }},
      "mode": "text",
      "text": {{ all_data.data['entity_type'] }},
      "textposition": "bottom center",
      "textfont": {
        "size": 15,
        "color": "black"
      },
    }
]