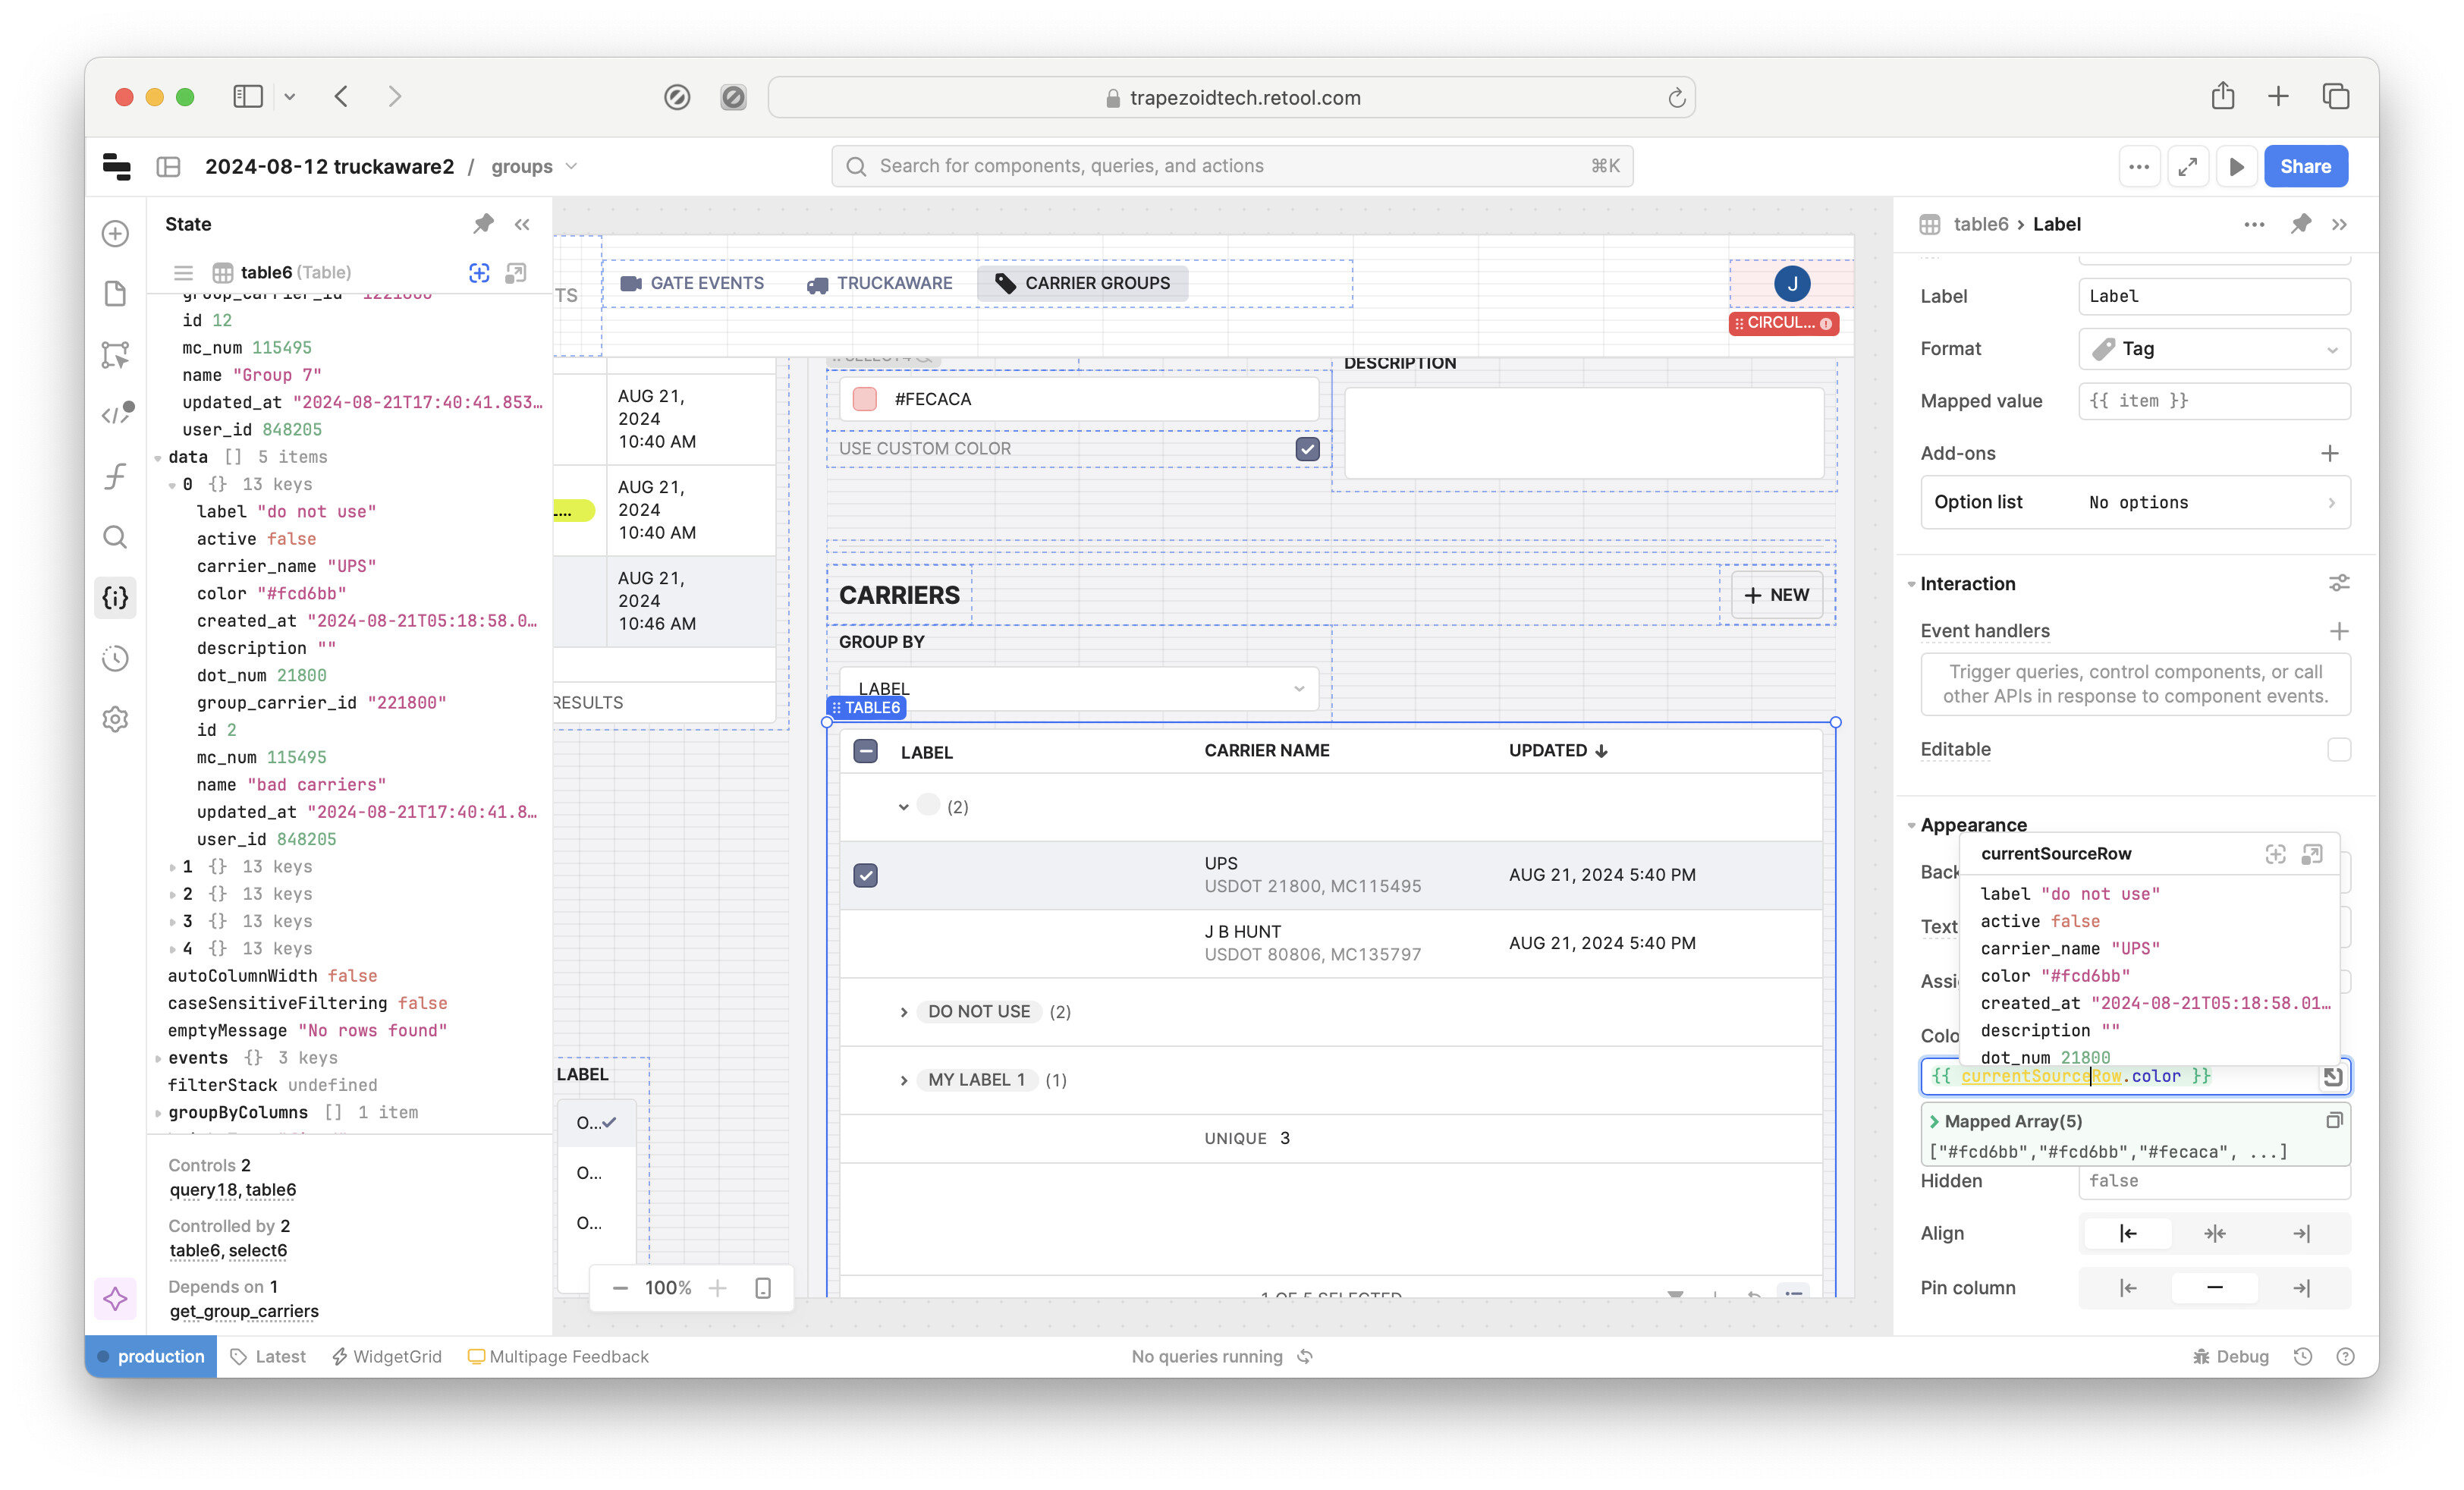
i have a table mapping strings to tags, and i want to group by either the string or the tag. however, it appears the tag color expects an array, which breaks upon grouping by the tag.
i assume this is because the array of source rows and the array of displayed rows are different lengths?
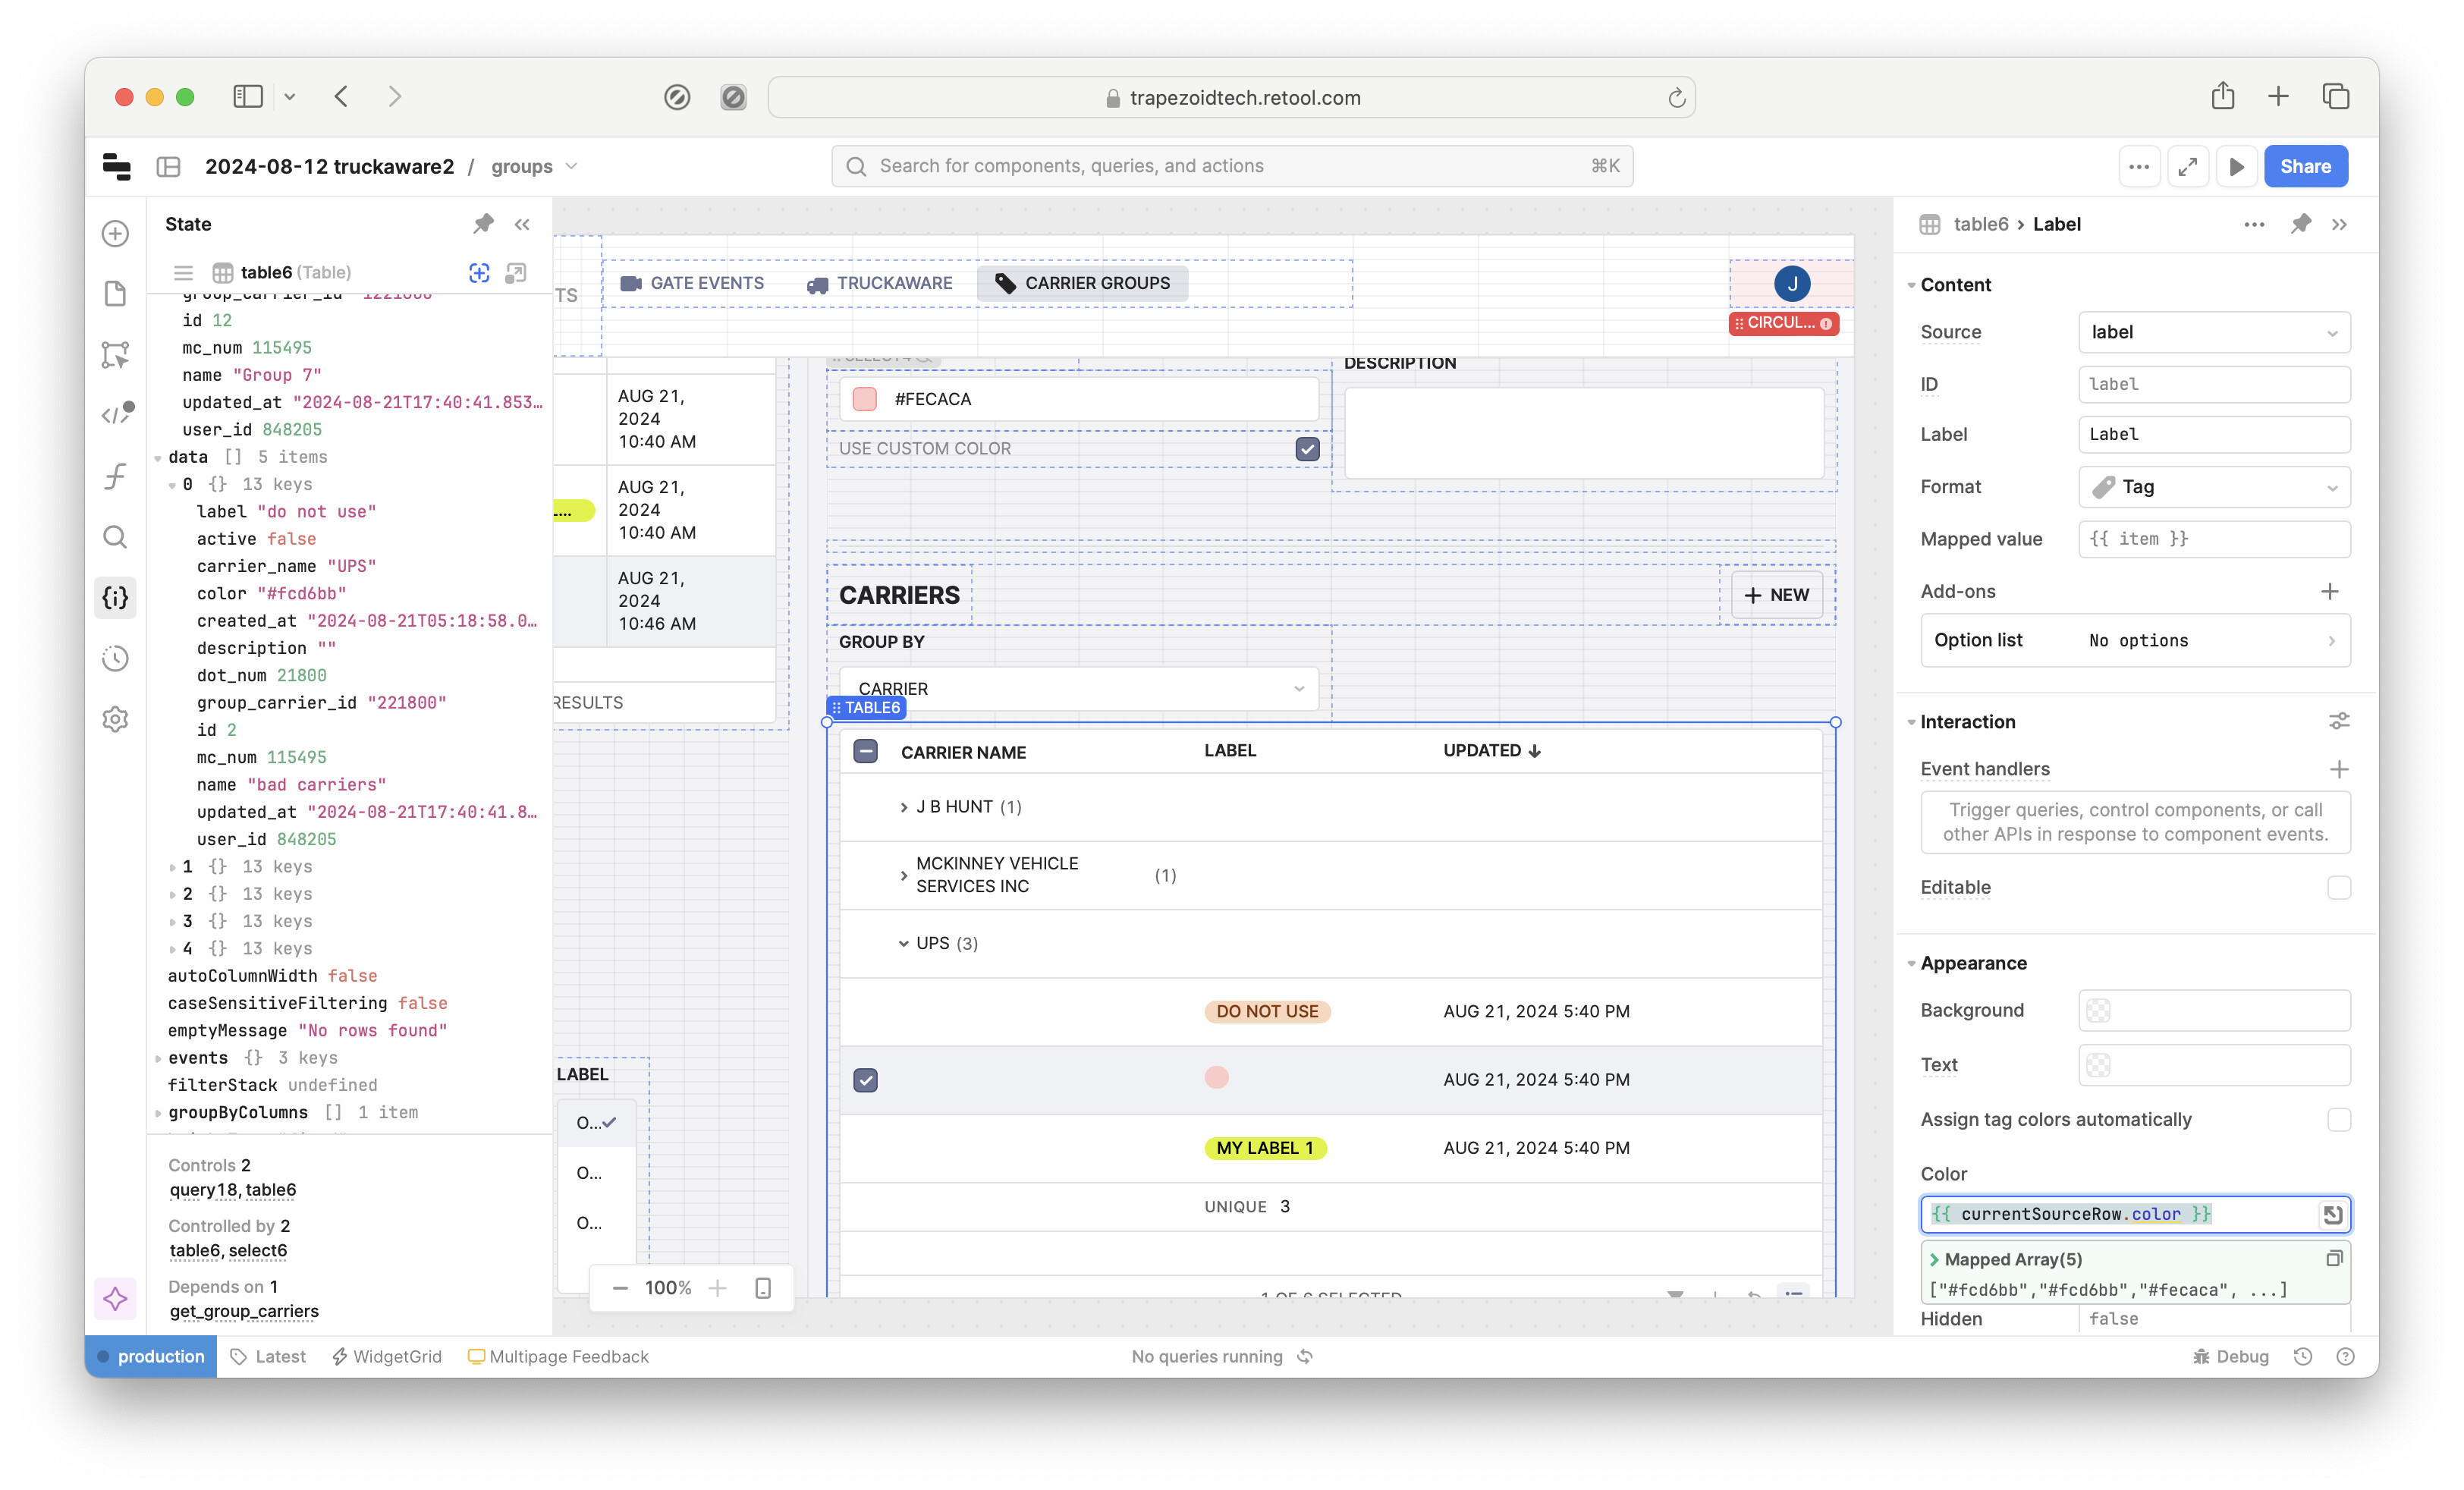
here's a screenshot of the tag colors working correctly when grouped by string:
this reminds me of SQL complaining about a column not listed in the GROUP BY clause, where i do not care which of the (identical) column values are returned, so i use
max(my_non_grouped_column) as my_non_grouped_column
is there a way to do with with currentSourceRow of a grouped-by table column in Retool?
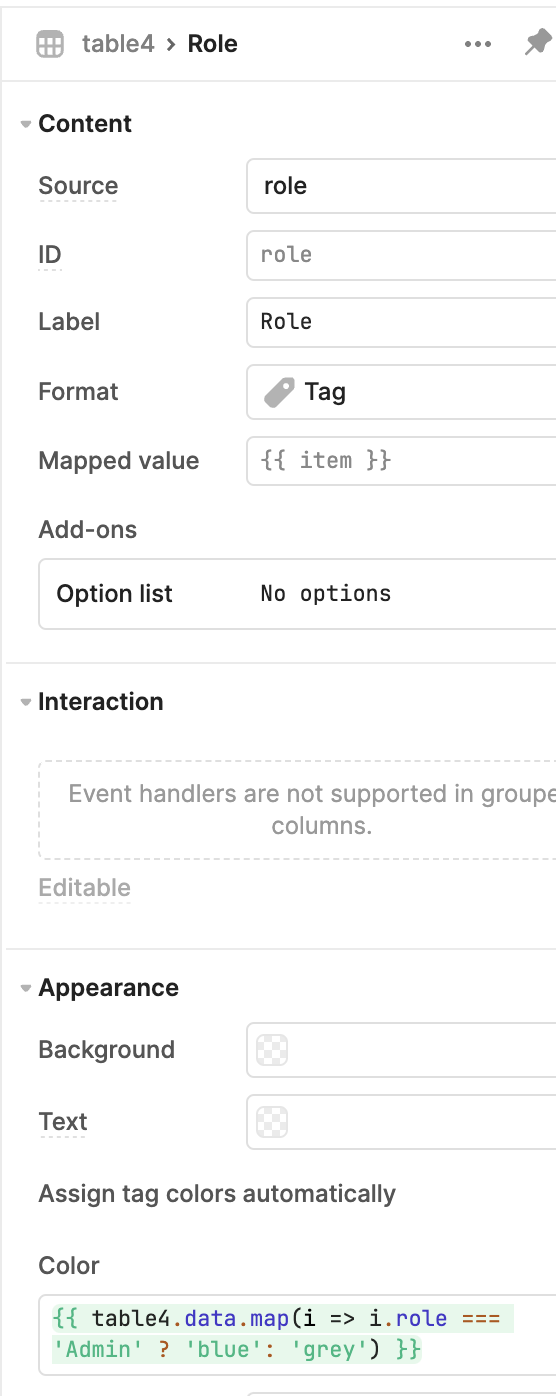
I just reproduced your table coloring and was not able to get the grouped tags to color properly
So I can make a feature request for this. I had tried to map over the table data as seen in my screenshot below but the displayed tags were all still gray and did not change colors as I had hoped.
Would it be helpful to have an iterator such as i or row to grab the .color property you want to use as the color data to assign to the current row's tag?
Hmm interesting ask. I can look into a FR for that.
Could you give me more details on how you would want that to work?
If the rows which each represent an event are grouped, and you had three work calls that were all colored blue at either over lapping or non-overlapping times, would you want a collapsible row titled "work calls" that would then open up and just show those three and so on for each category?
By 'use colored tags as the group label', the work call item would have a tag property which would be a string color, and the component would match these together with other rows under their .colorTags, right?
hey @Jack_T yeah this might be too niche -- something we could develop with existing retool features. but having a grid for the groups to put components inside of would be amazing:
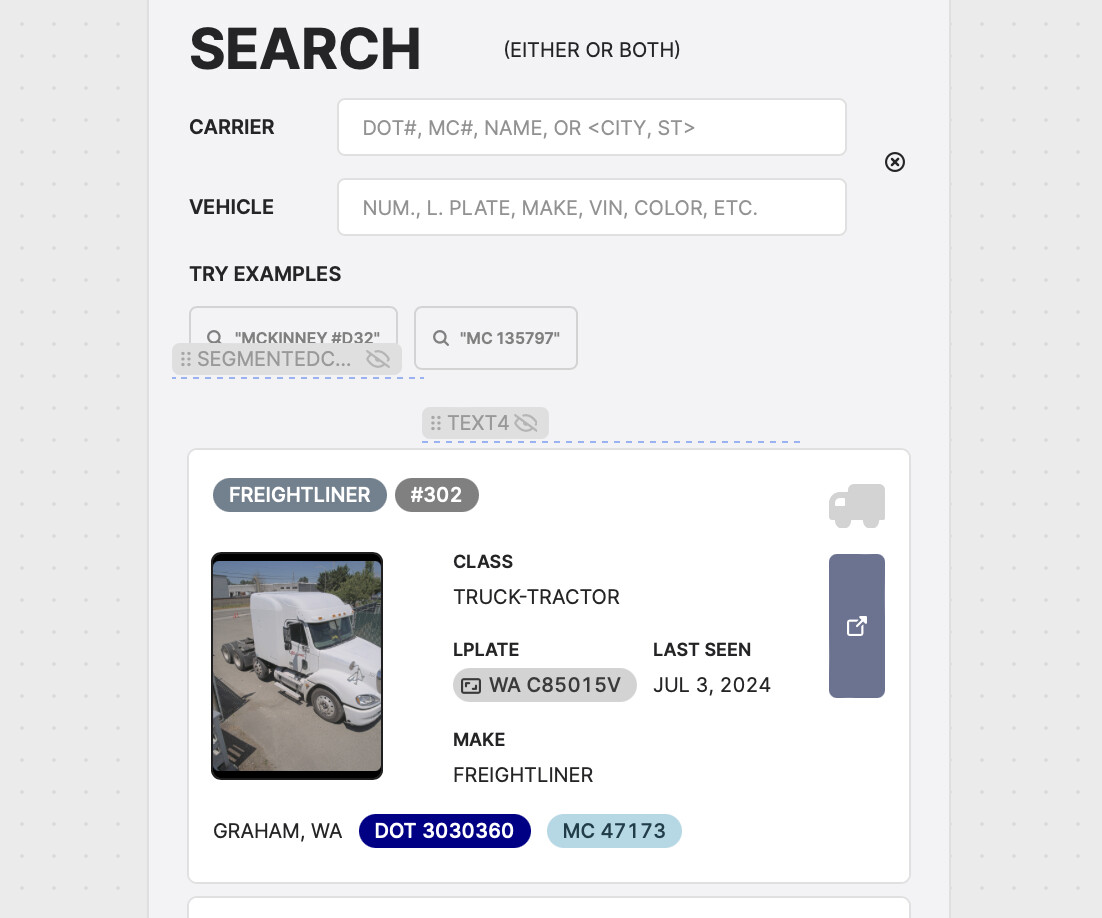
this is showing which carriers share a truck. very rough visually but the idea is there. we craft HTML for vis.js and it's just a huge pain. if we could drag in retool components (like Tags) instead, it would be awesome. in the same pattern we use throughout our app:
Ahhh very interesting, I am not familiar with vis.js but I did have another user asking about ways to draw/model out a cyclic graph in Retool and we currently don't have any components that can do that currently.
For more static visualizations I pointed them to Canva and using an image component but your use case sounds much more dynamic.
So the feature request would be for putting the groups(Tags) along with other Retool components inside of a single cell, correct?
In the way that your first picture on the left side within the red lines, you both have the tags for DOT, MC but also the image components for logos all living in a single table cell.
But instead of a table it would be in a timeline Component? Or would this be for a table?
hey @Jack_T yeah we would be happy with just company logo (single component) and then use components in a sidebar responding to onClick events for the MC and DOT tags too.
but yeah, in general having the group area be a Retool grid would be very powerful!
So the Retool grid would group rows by company logo (image component, this might be currently do-able?) and then either the same or different rows would have cells with two tags (MC and DOT) which would each have their own onClick events?
i was thinking in lieu of multiple components (logo, mc, and dot) it would be fine to have just the logo, and then onClick of any event in that row, i could respond with a dynamic sidebar (or header, or whatever) to show the additional components.
does that make sense?
honestly making the group area be its own grid like a container, with {{item}}, would be fantastic.
maybe there’s a better way to show this… we started with a network graph and struggled to format it with indicators about time, so we added a timeline.
Apologies for the late response, I have been out of office
For having a single logo in the row that can handle on click, we might already have this via cell click events.
It kinda sounds like instead of a dynamic sidebar you could have a collapsible row which will very easily receive row data and can pass it to components to display information as you would like!