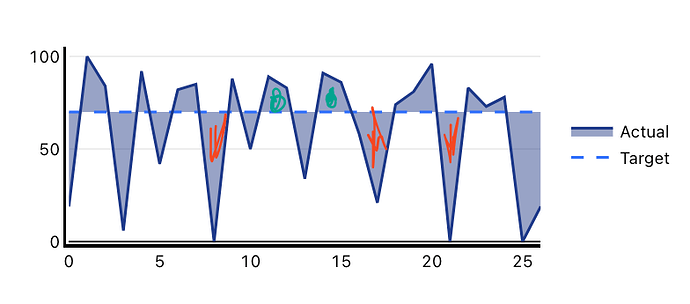
I am trying to dynamically populate the fill color between two lines in my graph
When the actual is greater than the target, I want the fill as green, and when it's less than, I want the fill as red.
I've actually created a field in my objects that I'm plotting called "chart_fill_color" that automatically calculates what the fill color should be between 2 y-points for the same x-axis point but I didn't have any luck.
I've attached both the plotly configs below.
Any help would be greatly appreciated!
Data Plotly JSON:
[
  {
    "name": "Target",
    "x": {{formatDataAsObject( query.data )['week_number']}},
    "y": {{formatDataAsObject( query.data )['metric_target']}},
    "type": "scatter",
    "mode": "lines",
    "line": {
      "color": "#3170F9",
      "dash": "dash"
    },
    "transforms": [
      {
        "type": "sort",
        "target": {{formatDataAsObject( query.data)['week_number']}},
        "order": "ascending"
      }
    ]
  },
  {
    "name": "Actual",
    "x": {{formatDataAsObject( query.data )['week_number']}},
    "y": {{formatDataAsObject( query.data )['metric_value']}},
    "type": "scatter",
    "mode": "lines",
    "line": {
      "color": "#1E3A8A"
    },
    "fill": "tonexty",
    "fillcolor": {{formatDataAsObject( query.data )['chart_fill_color']}},
    "hovertemplate": "<b>%{x}</b><br>%{fullData.name}: %{y}<extra></extra>",
    "transforms": [
      {
        "type": "sort",
        "target": {{formatDataAsObject( query.data )['week_number']}},
        "order": "ascending"
      }
    ]
  }
]
Layout Plotly JSON:
{
  "title": {
    "text": {{query.data[0].readable_metric_name}},
    "font": {
      "color": "#000000",
      "size": 22,
      "weight": "bold"
    }
  },
  "font": {
    "family": "var(--default-font, var(--sans-serif))",
    "color": "#000000"
  },
  "showlegend": true,
  "legend": {
    "xanchor": "left",
    "orientation": "v",
    "x": 1.05,
    "y": 0.5
  },
  "margin": {
    "l": 16,
    "r": 24,
    "t": 80,
    "b": 32,
    "pad": 2
  },
  "hovermode": "closest",
  "hoverlabel": {
    "bgcolor": "#000",
    "bordercolor": "#000",
    "font": {
      "color": "#fff",
      "family": "var(--default-font, var(--sans-serif))",
      "size": 12
    }
  },
  "clickmode": "select+event",
  "dragmode": "select",
  "xaxis": {
    "title": {
      "text": "",
      "standoff": 6,
      "font": {
        "size": 12
      }
    },
    "type": "-",
    "tickformat": "",
    "automargin": true,
    "fixedrange": true,
    "gridcolor": "#fff",
    "zerolinecolor": "#fff",
    "linecolor": "#000000",
    "linewidth": 2,
    "showline": true,
    "mirror": false
  },
  "yaxis": {
    "title": {
      "text": "",
      "standoff": 6,
      "font": {
        "size": 12
      }
    },
    "type": "linear",
    "tickformat": "",
    "automargin": true,
    "fixedrange": true,
    "zerolinecolor": "#000000",
    "rangemode": "nonnegative",
    "linecolor": "#000000",
    "linewidth": 2,
    "showline": true,
    "mirror": false
  }
}
