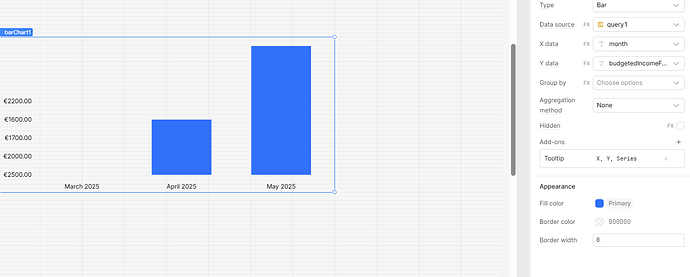
Hello @luismarcos,
I'm not entirely sure about the issue with duplicate x-axis labels, but I can provide a solution for formatting the € (Euro) currency using D3 in Retool charts.
You can refer to my previous response on the community forum for more details: How to set D3 locale currency format (€) in charts? € - #3 by WidleStudioLLP
Here is the relevant JavaScript code :
// Your updated raw data (replacing old rawData)
const rawData = [
  { month: "March 2025", actualIncome: 2200, budgetedIncome: 2500 },
  { month: "April 2025", actualIncome: 2500, budgetedIncome: 2000 },
  { month: "April 2025", actualIncome: 1800, budgetedIncome: 1700 },
  { month: "May 2025", actualIncome: 6000, budgetedIncome: 1600 },
  { month: "May 2025", actualIncome: 0, budgetedIncome: 2200 }
];

// Define a custom D3 locale for Euro formatting
const locale = d3.formatLocale({
  decimal: ".",
  thousands: ",",
  grouping: [3],
  currency: ["€", ""]
});

// Create a currency formatter
const formatCurrency = locale.format("$.2f");

// Return formatted data for use in charts (e.g., labels or tooltips)
return rawData.map(item => ({
  ...item,
  actualIncomeFormatted: formatCurrency(item.actualIncome),
  budgetedIncomeFormatted: formatCurrency(item.budgetedIncome)
}));
Let me know if you have any further questions!
