Plotly chart has warning "datasource: e.foreach is not a function" but still works fine?

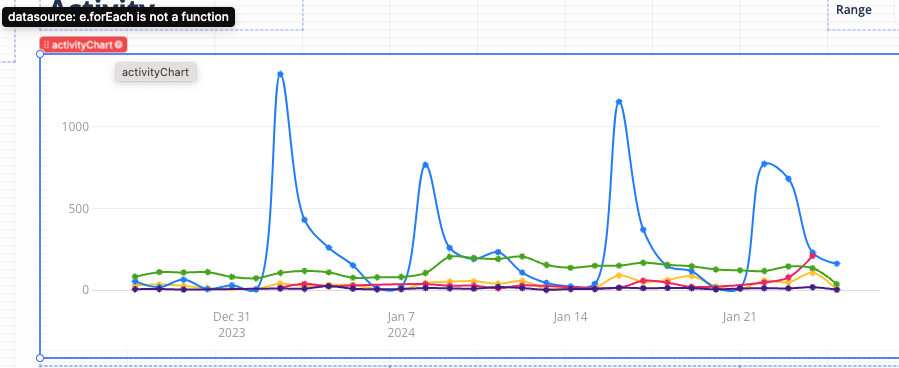
I have a chart that I recently built in an app that has a red error / warning status on the component, but the chart is rendering fine. The chart's data comes in from our database and then is a line chart with transforms to split the lines out over a time period.

The data is being fed from a Transformer due to a post-query change I wanted to include the "Total" of a value in the Legend values.

There is also a post-query Transformations on the query itself as it comes off the database.

These queries have .foreach loops in them, however, I've tried removing them and just having the straight data feed and that still leaves the error on the component.

As far as I can tell, the chart is rendering fine, and when I open up the Plotly editing panes in the component inspector, all of the data references are green.

What am I missing? Thanks!

same here on a donut chart: "xAxis: e.forEach is not a function". Renders fine.

data input:

{{
  data.isFetching || data.data === null || data.data === undefined? 
    [{
      labels: [],
      values: [],
      domain: {column: 0},
      name: 'Hours',
      hoverinfo: 'label+value+percent+name',
      hole: .4,
      textinfo: "label+value",
      textposition: "outside",
      automargin: true,
      type: 'pie'
    }]
    : 
    [{
      labels: data.data.labels,
      values: data.data.hours,
      domain: {column: 0},
      name: 'Hours',
      hoverinfo: 'label+value+percent+name',
      hole: .4,
      textinfo: "label",
      textposition: "outside",
      automargin: true,
      type: 'pie'
    }]
}}

layout input:

{
  "title": {
    "text": "Hours",
    "font": {
      "color": "#3D3D3D",
      "size": 16
    }
  },
  "font": {
    "family": "var(--default-font, var(--sans-serif))",
    "color": "#979797"
  },
  "showlegend": false,
  "margin": {
    "l": 16,
    "r": 24,
    "t": 32,
    "b": 32,
    "pad": 2
  },
  "hovermode": "closest",
  "hoverlabel": {
    "bgcolor": "#000",
    "bordercolor": "#000",
    "font": {
      "color": "#fff",
      "family": "var(--default-font, var(--sans-serif))",
      "size": 12
    }
  },
  "clickmode": "select+event",
  "dragmode": "select"
}

Hi there! Thanks for reaching out.

@jens I'm not able to reproduce this error with the set up you provided & dummy data. Where is data defined? It's a reserved word, so if you have a query named data it could be worth trying to rename it.

Sometimes errors can occur in fields that aren't being used, such as invalid data in the UI form that didn't get cleared before switching over to the Plotly JSON tab

For either chart, happy to take a closer look if you export your app with a snapshot of the data.

@Tess Thanks for looking into this.

I actually don't have a var named data; I changed the name here.

However, I rebuilt the chart from scratch, and now the error is gone.

Perhaps it's as you suggested - some leftovers from former edits. I'm pretty sure I copied another chart and changed the setup.

Thanks again - closed for me,
Jens

1 Like

Got it! Well, I'm glad rebuilding it "resolved" it :slightly_smiling_face: Let us know if anything else unexpected comes up

@StuartL it could be worth trying the same!

Thanks for the tip. Creating a new component and copy / pasting in the plotly logic directly worked and got me past this original issue.

Now I'm seeing and error on the chart : xAxis : unexpected identifier "On"

Chart still renders fine as before, but I don't have any "On" in my transformer or other query code.

To clarify, it looks like that is a Linting warning, not an error, which explains why things continue to work. I do have some values on the xAxis which include the word "On", but unsure why it would break that out of a longer string and get tripped up on it.

I'm not sure either! If you want to send the export I can keep digging into it. Yes, end users should be able to use the chart as expected

Apologies for the dumb question, but how can I export?

It's hard to find! I sent a screenshot above where you can click on the debug tools & then export to JSON

You can also click the three dots button in the top right corner and select Export to JSON

Ok, so I did that and its just an empty json file. Am I missing something?

Hmm, that is strange :thinking: No, I don't think you're missing something, but it should have the json to populate your app. Did you try both approaches (three dots button & debug tools)?

Aha! I got it to export from the top three dots at the top in edit mode.

From there, I was able to get to the heart of the issue: settings that were loaded in the "UI Form" view were hidden and causing the issue (data loading incorrectly as a raw string rather than encapsulated).

I was able to recreate the chart again and resolve the issue with a different root "data source". I did have to "revert" my Plotly changes once to put some loading safeties on the UI Form data groups to avoid more errors, but I believe the disconnect between Plotly overrides and the obscured UI Form entries are the root issue here.

If the chart is going to inherit things from the UI Form, retool shouldn't hide those settings. I get why (to avoid confusion), but instead it lead me to many more hours of confusion as to why the chart was behaving as intended but still erroring / linting (because settings under the hood obscured from me were still applying).

1 Like

Thanks for the detailed explanation, @StuartL. I'm glad it's resolved for now, but this is definitely buggy behavior in the component :disappointed: