Hi I'm trying to build a wordCloud using custom component and anyChart. Here is the HTML code for that:
Challenge I'm facing here to render my data from model. The hard coded data array data=[
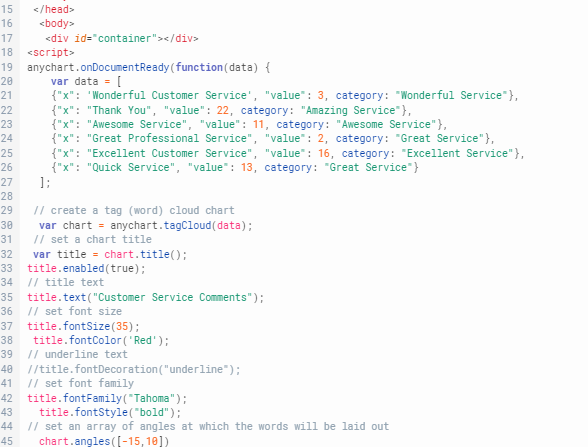
{"x": 'Wonderful Customer Service', "value": 3, category: "Wonderful Service"},
{"x": "Thank You", "value": 22, category: "Amazing Service"},
{"x": "Awesome Service", "value": 11, category: "Awesome Service"},
{"x": "Great Professional Service", "value": 2, category: "Great Service"},
{"x": "Excellent Customer Service", "value": 16, category: "Excellent Service"},
{"x": "Quick Service", "value": 13, category: "Great Service"}
]
works, but couldn't get/render the variable data from model using retool react component.
Any help will be appreciated.
Hi @m.rahman !
It looks like you're missing some calls to Retool model helpers to get it rendering within Retool properly.
Here's an example of how to render the example chart from anyChart's Quick Start:
Model:
{
 data: [
        ["Chocolate", 5],
        ["Rhubarb compote", 2],
        ["Crêpes Suzette", 20],
        ["American blueberry", 2],
        ["Buttermilk", 7]
    ]
}
IFrame:
<script src="https://cdn.anychart.com/releases/8.11.0/js/anychart-base.min.js" type="text/javascript"></script>

<div id="container" style="width: 500px; height: 400px;"></div>

<script type="text/babel">
 anychart.onDocumentLoad(function () {
      // create an instance of a pie chart
       var chart = anychart.pie();
       window.Retool.subscribe(function(model) {

      // set the data
        chart.data(model.data);
      // set chart title
      chart.title("Top 5 pancake fillings");
      // set the container element
      chart.container("container");
      // initiate chart display
      chart.draw();
    })

});
</script>
Note the calls to window.Retool.subscribe and chart.data(model.data).
Can you try adapting your code similarly?
1 Like
Hey @m.rahman, did you figure it out?