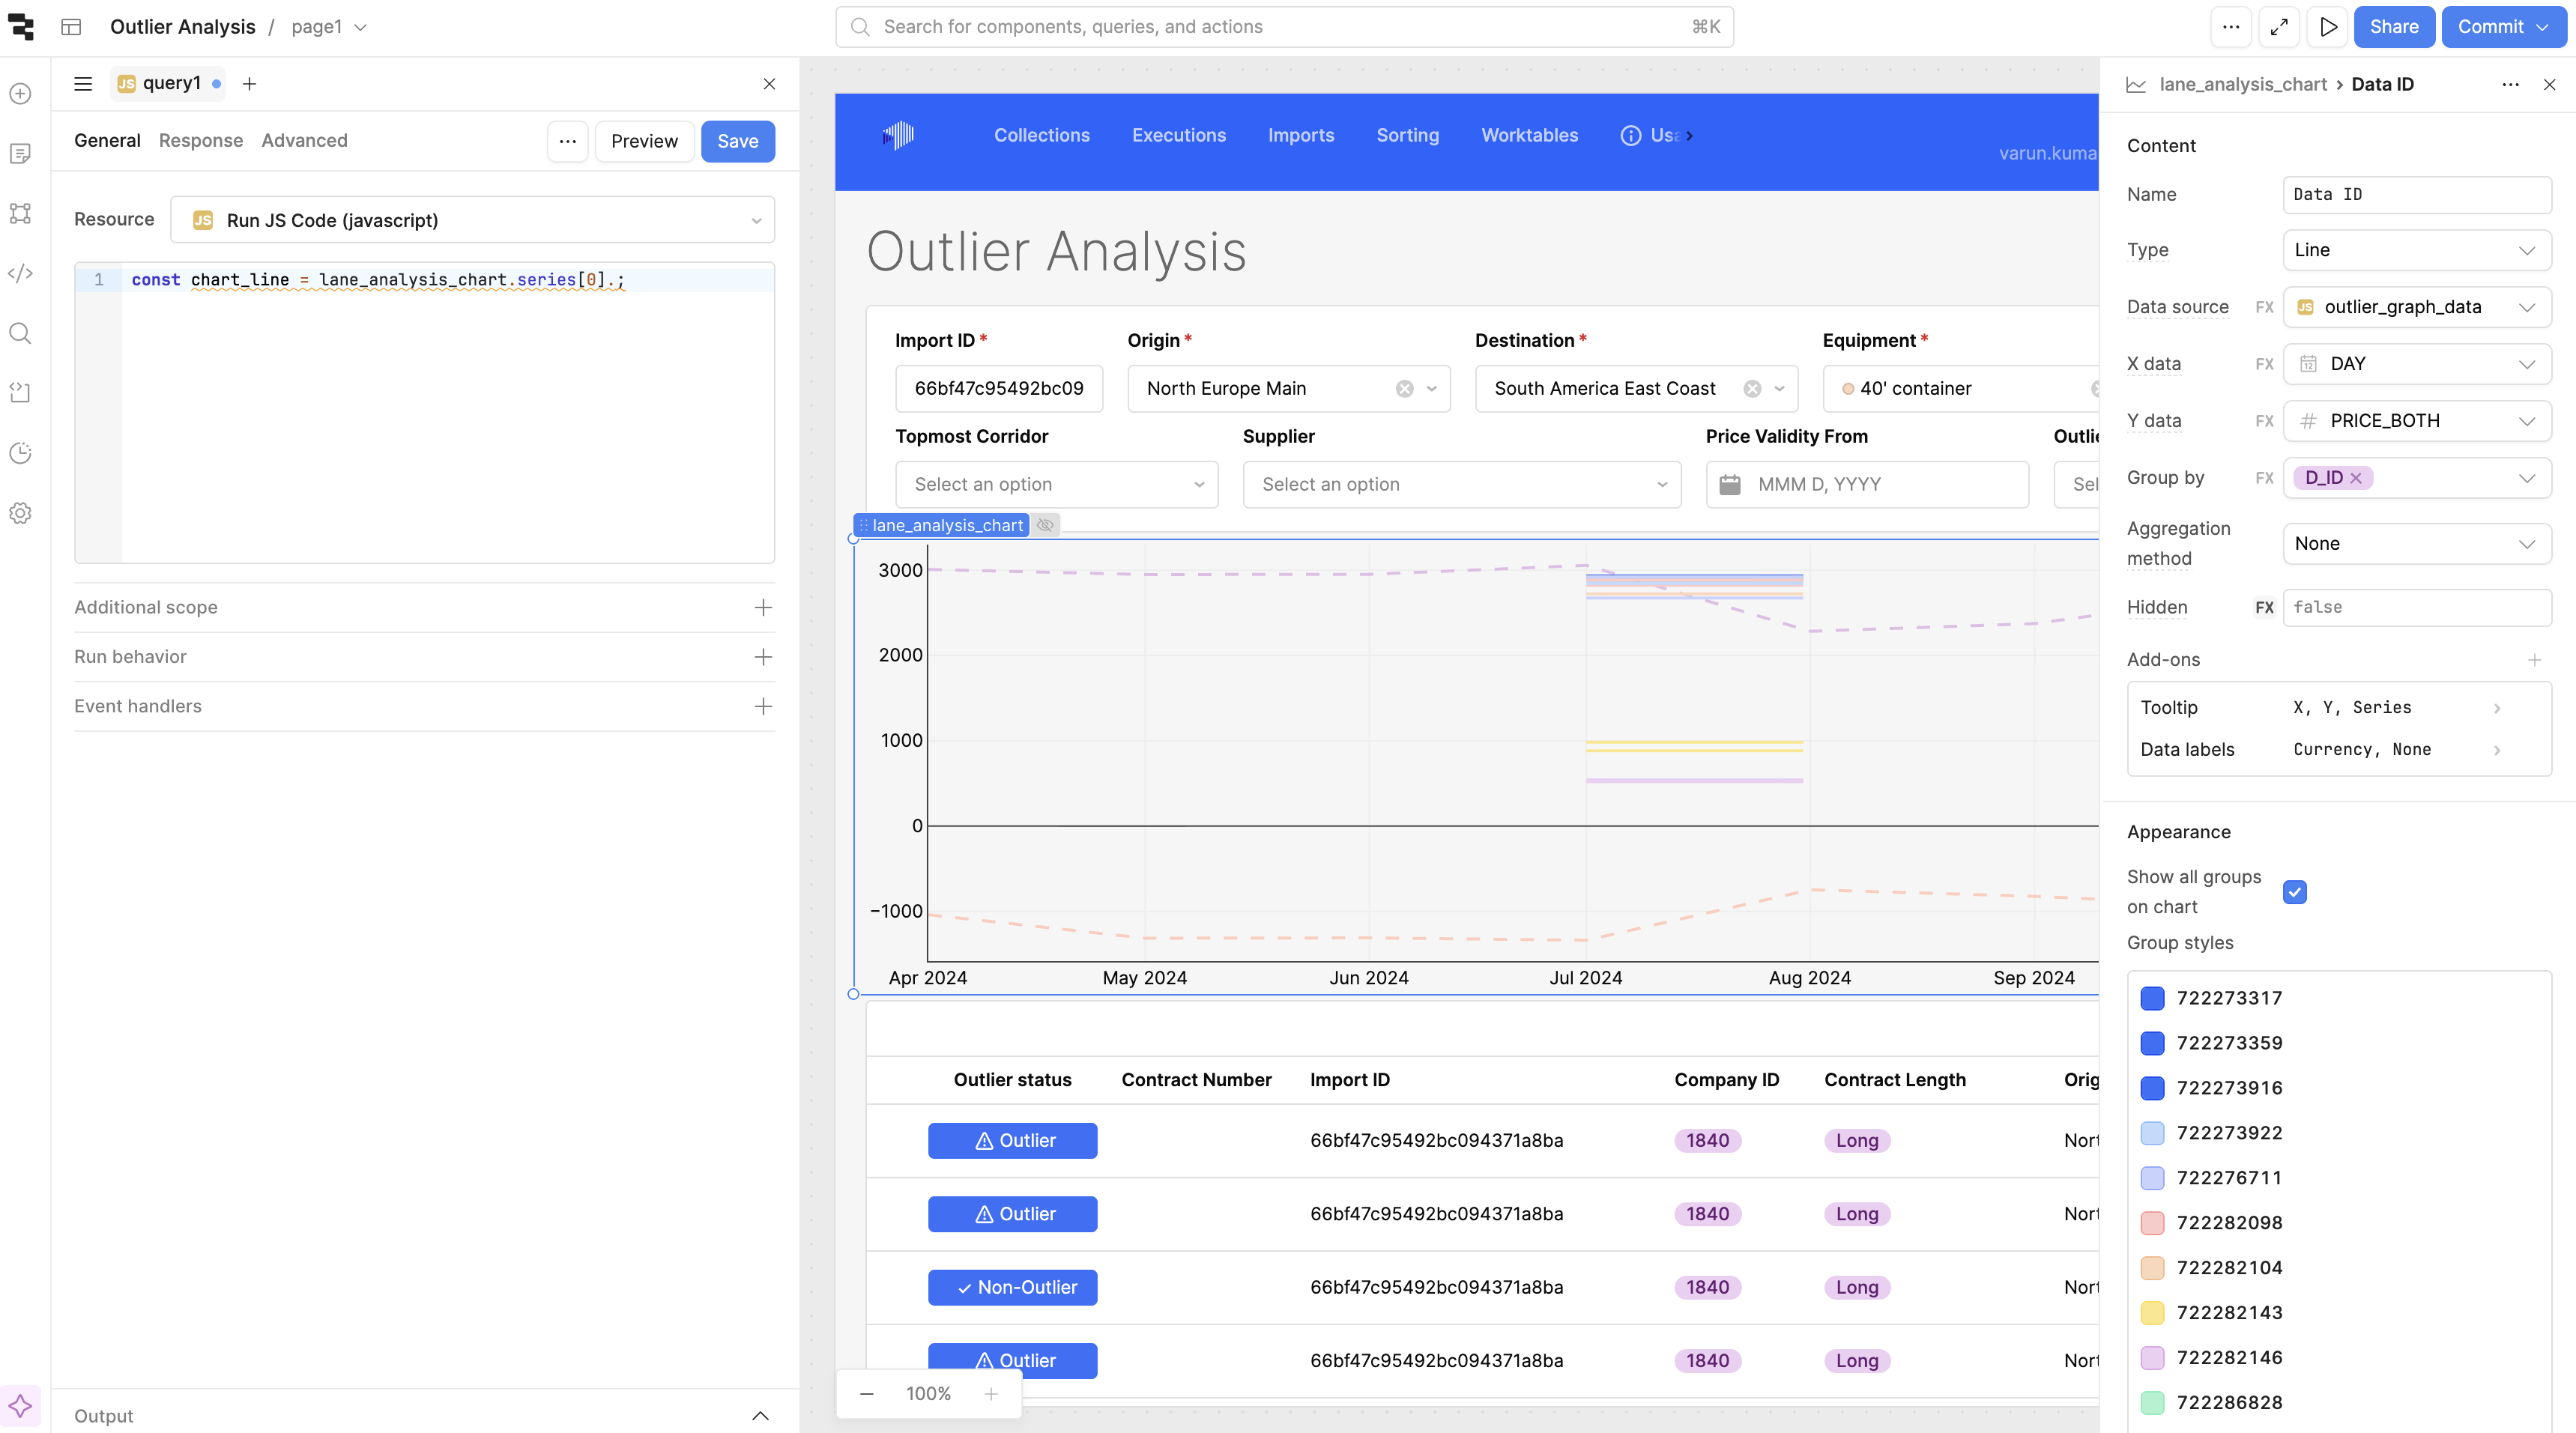
I want to make all lines of the plot with same colors instead of automated colors. I tried many was and searched many places but most of the time it is referred to older graphs where you can put down configuration but in newer version maybe you can not.
Please let me know if there is any way to select the color. Even if it is selected when the graph is made due to grouping option the automated colors are shown. I tried editing one by one but that is not an optimal solution. If I can change by JS that is also ok with me.
1 Like
Hey @Varun_Kumar , Welcome to Retool Community.
I ran into the same issue with the new Retool Line Chart when using Group by — Retool automatically assigns different colors to each generated series, and there is currently no supported way to force a single color across all grouped lines in the new chart engine.
A reliable and flexible workaround is to use a Plotly JSON Chart, which allows full control over styling (color, dash, width) even when rendering multiple grouped series.
Below is a complete working example that reproduces the same visual behavior (multiple lines, same color, dashed style).
Mock Data (for testing)
return [
  { day: "2024-04-01", id: "A", price: 3000 },
  { day: "2024-05-01", id: "A", price: 2950 },
  { day: "2024-06-01", id: "A", price: 2980 },
  { day: "2024-07-01", id: "A", price: 3050 },
  { day: "2024-08-01", id: "A", price: 2300 },
  { day: "2024-09-01", id: "A", price: 2400 },

  { day: "2024-07-01", id: "B", price: 2900 },
  { day: "2024-08-01", id: "B", price: 2850 },

  { day: "2024-07-01", id: "C", price: 2750 },
  { day: "2024-08-01", id: "C", price: 2800 },

  { day: "2024-07-01", id: "D", price: 900 },
  { day: "2024-08-01", id: "D", price: 900 },

  { day: "2024-07-01", id: "E", price: 500 },
  { day: "2024-08-01", id: "E", price: 500 },

  { day: "2024-04-01", id: "F", price: -1100 },
  { day: "2024-05-01", id: "F", price: -1300 },
  { day: "2024-06-01", id: "F", price: -1250 },
  { day: "2024-07-01", id: "F", price: -1200 },
  { day: "2024-08-01", id: "F", price: -800 },
  { day: "2024-09-01", id: "F", price: -900 }
];
Plotly Series Builder (Run JS Code)
const raw = {{ mock_outlier_plotly_data }};
const groups = {};

raw.forEach(r => {
  if (!groups[r.id]) groups[r.id] = { x: [], y: [] };
  groups[r.id].x.push(r.day);
  groups[r.id].y.push(r.price);
});

const COLOR = "#B794F4"; // same color for all lines

return Object.entries(groups).map(([id, d]) => ({
  type: "scatter",
  mode: "lines",
  name: id,
  x: d.x,
  y: d.y,
  line: {
    color: COLOR,
    width: 2,
    dash: "dash"
  },
  opacity: 0.7,
  hovertemplate:
    "<b>ID:</b> " + id +
    "<br><b>Date:</b> %{x}" +
    "<br><b>Price:</b> %{y}<extra></extra>"
}));
Plotly Layout (JSON)
{
  "xaxis": {
    "type": "date",
    "tickformat": "%b %Y",
    "showgrid": false
  },
  "yaxis": {
    "zeroline": true,
    "zerolinecolor": "#444",
    "showgrid": true,
    "gridcolor": "#f1f1f1"
  },
  "hovermode": "closest",
  "showlegend": false,
  "margin": {
    "l": 60,
    "r": 30,
    "t": 20,
    "b": 50
  },
  "paper_bgcolor": "#ffffff",
  "plot_bgcolor": "#ffffff"
}
Summary
- The new Retool Line Chart auto-assigns colors when grouping and does not currently support forcing a single color.
- Plotly JSON Chart avoids this limitation by letting you explicitly control styling per trace.
- This approach is stable, repeatable, and works well for outlier analysis and trend comparison use cases.
I’ve attached a screenshot of the resulting chart for reference.
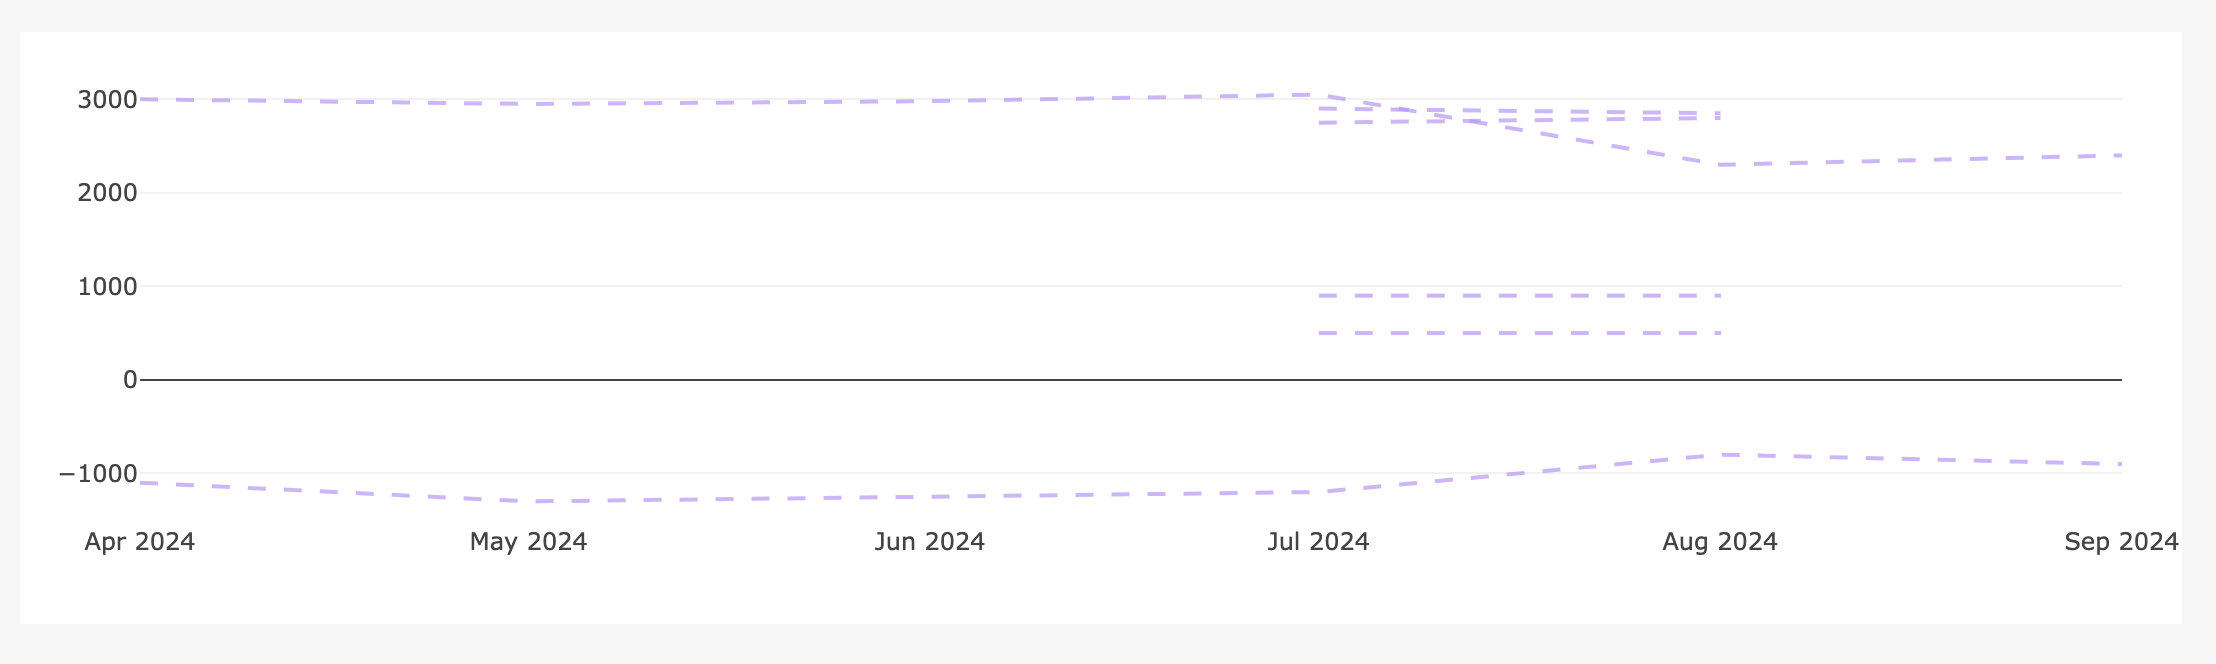
Hope this helps!
Hi @Varun_Kumar,
You could add a theme to your app (see docs for plan restrictions). Once you add a theme, the group colors will come from App Theme -> Automatic colors. If you only set one color, it should make all lines the same color.
Just be mindful that this color could then get used in other places within your app!