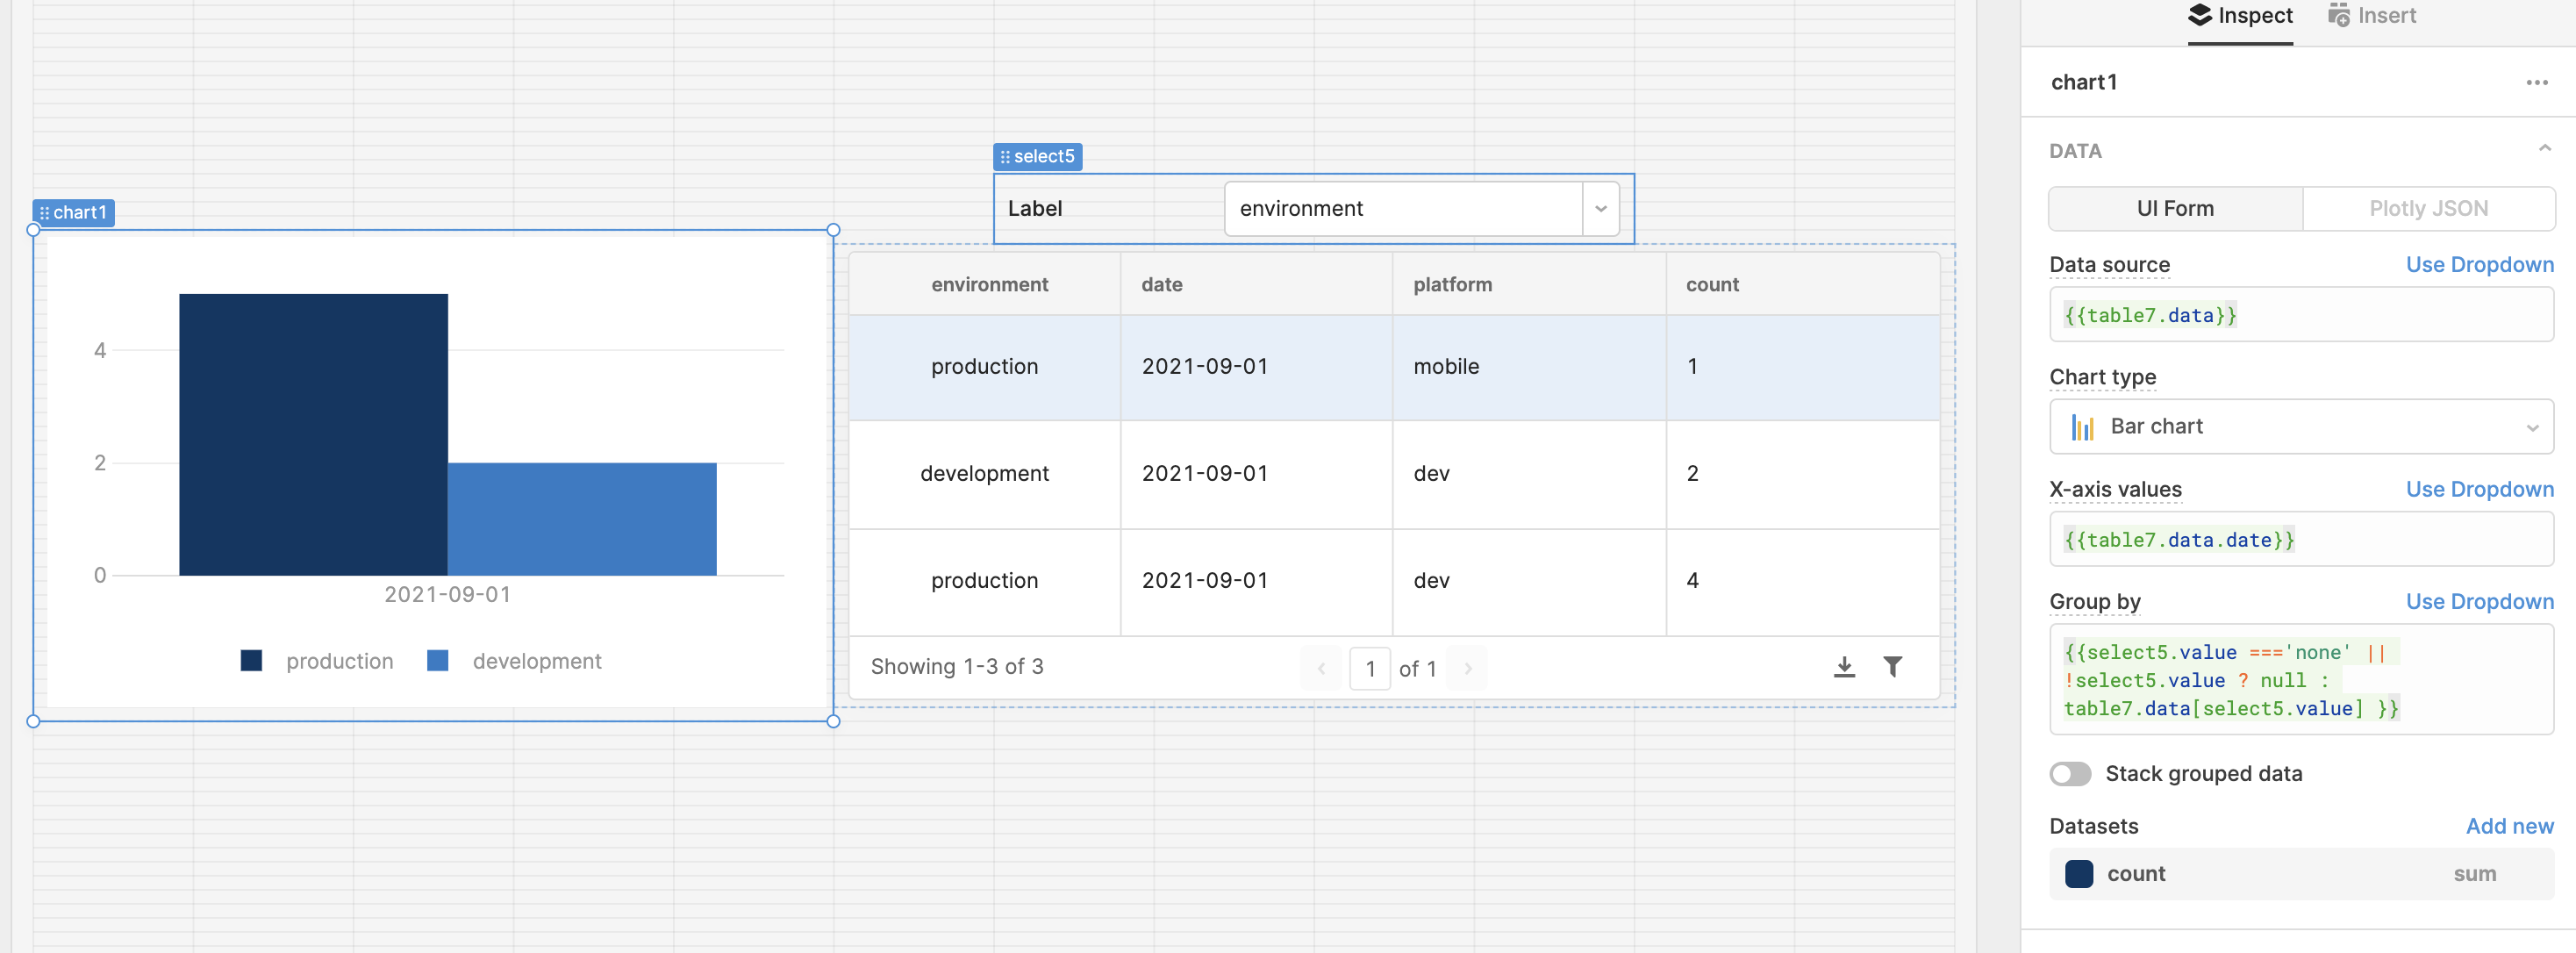
I have a line chart from a table like:
date | platform | environment | count
2021-09-01 | mobile | production | 10
2021-09-01 | web | development | 2
...
I want the line chart's group by property to be controlled by a select component, where I can select "None", "Platform", and "Environment".
I can easily create 3 separate charts, but wondering if using some javascript in the group by property of the chart would allow this to be a control.