I have a table with dynamic column settings, making visible columns based on a multi select.
Also I have a corresponding chart that takes the table's data as datasource.
The problem is that the chart doesn't follow the visibility column settin, it just takes all the table data as datasource.
How can I have the chart to only get the visible columns of the table??
Any ideas here? How can I choose chart's datasource dynamically from a table?
Hey @p.siontoros! So the Table component has a .columnVisibility property that you can use here. The structure looks like this:
{
'capital': true,
'continent': true,
'countries': true,
'languages': false
}
When you're referencing the data in your chart, you could write some Javascript that checks against this object and only selects columns that have a value of true. I'm still working on the JS logic for how to do that, but it's something along the lines of this:
{{ table1.data.filter(row => Object.keys(row).includes(Object.entries(table1.columnVisibility).filter(([key,column]) => column === true).map(array => array[0]))) }}
Will report back when I get it working! Hopefully this is a good start 
Hi @justin ! Before going into the javascript, I explored this .columnVisibility property you mentioned.
I noticed that it has 'true' to all the columns but I have visible only 3 or 4. It doesn't seem right..
I am using dynamic column settings in the whole table to select the visible columns.
Hey @p.siontoros!
Thanks for flagging this! This does look like a bug so I've gone ahead and built out a repro app/ bug report and will update this thread once a fix is merged. In the meantime, one workaround here could be to filter on the results of your multi-select component.
You could build out a pre-loaded javascript function to do the following:
window.filterChartInputs = (array, data) => {
  return data.map(row=> {
    let newRow = {}
    array.forEach(col=>newRow[col]=row[col])
    return newRow
  })
}
This would filter the tables data for any columns returned from the array. Next, you could call this function using your data in the chart component using something like:
{{filterChartInputs(multiselect1.value,table1.data)}}
Do you think this could work for your use case here?
Hi @Chris-Thompson
Sure it will work.
That's how I am dealing this now😉
Thanks for the response!
Hey Chris or Justin,
Any chance this could be used in a similar fashion to dynamically pull specific datasets from a table into a chart? Ideally, I could link the chart to this dropdown (which it is not currently).
Hey Justin - commenting here so you know about the question I asked Chris below.
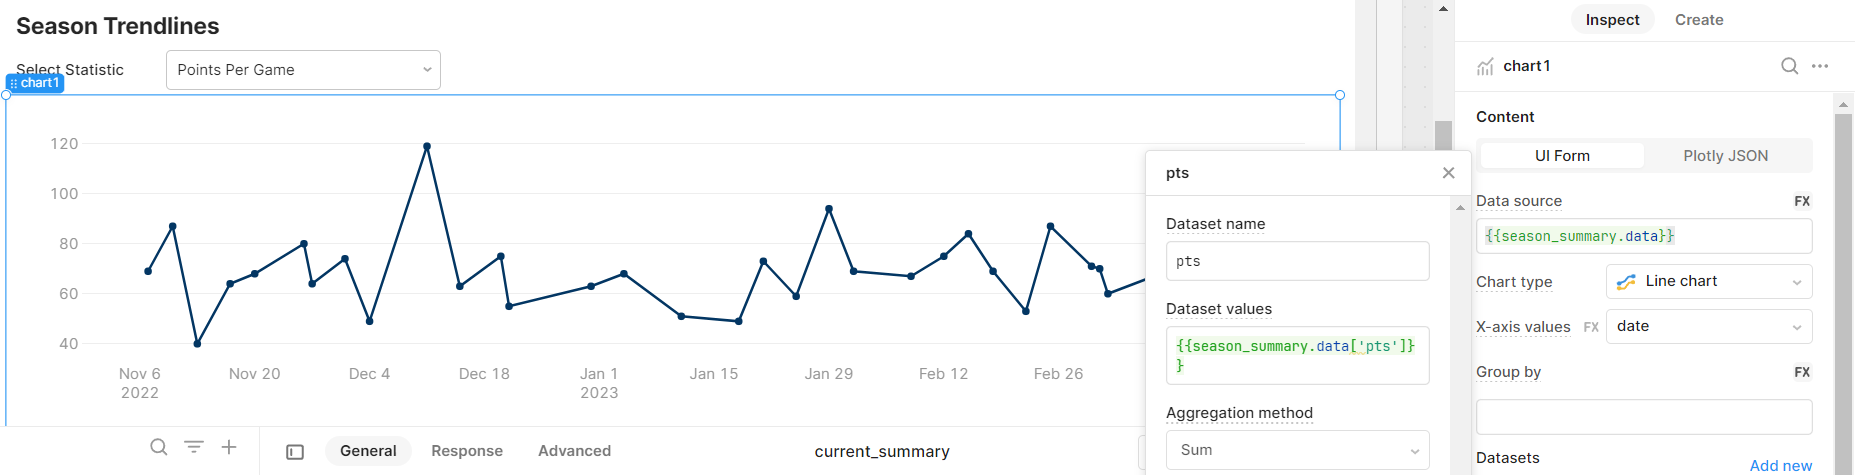
Hey @RCarlson3232!
The transformer you're passing to the Dataset values field is dynamic so you can change how you're keying into it based on the value of your select component by using something like {{season_summary.data[select1.value]}} instead of {{season_summary.data['pts']}}. To be able to do that you'd want the values of the select to correspond with the keys in season_summary.data while leaving the labels as they are:

Does that work?
Hey @Kabirdas - this is exactly what I need! Thank you!!