Hi everyone,
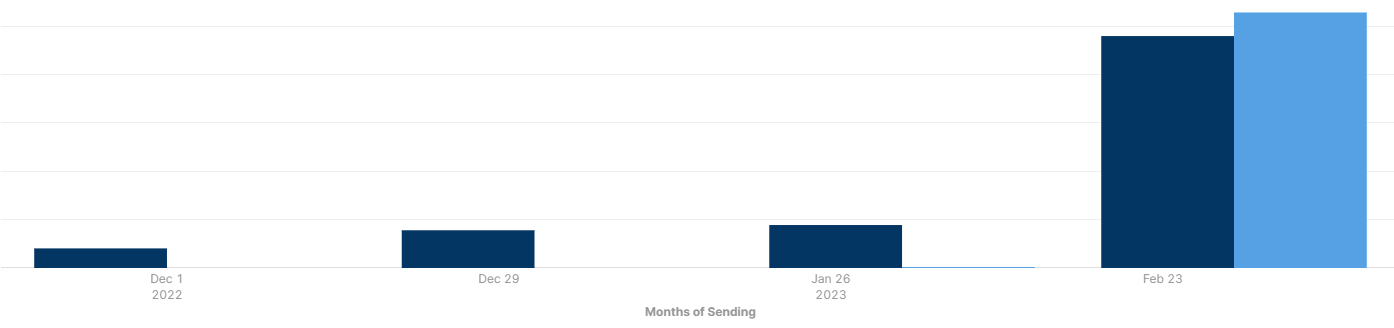
I'm trying to organise my chart into showing either the 1st of each month or just the month.
Currently this is how it looks but the table above which I am getting the data from have been sorted into the 1st of each month(Sorry, can't show due to data protection). The table component seems to have more functionality in changing the date column but I can't see anything similar in the chart component.