If it's possible to do this, I couldn't figure out how. Maybe there's a workaround?
Is it possible to include the "config" variable for charts in the future?
Some features in the modebar add a ton of interactivity to charts.
Another thing that's missing is selectedRange, I believe. SelectedPoints works fine, but selecting a range would be huge for me.
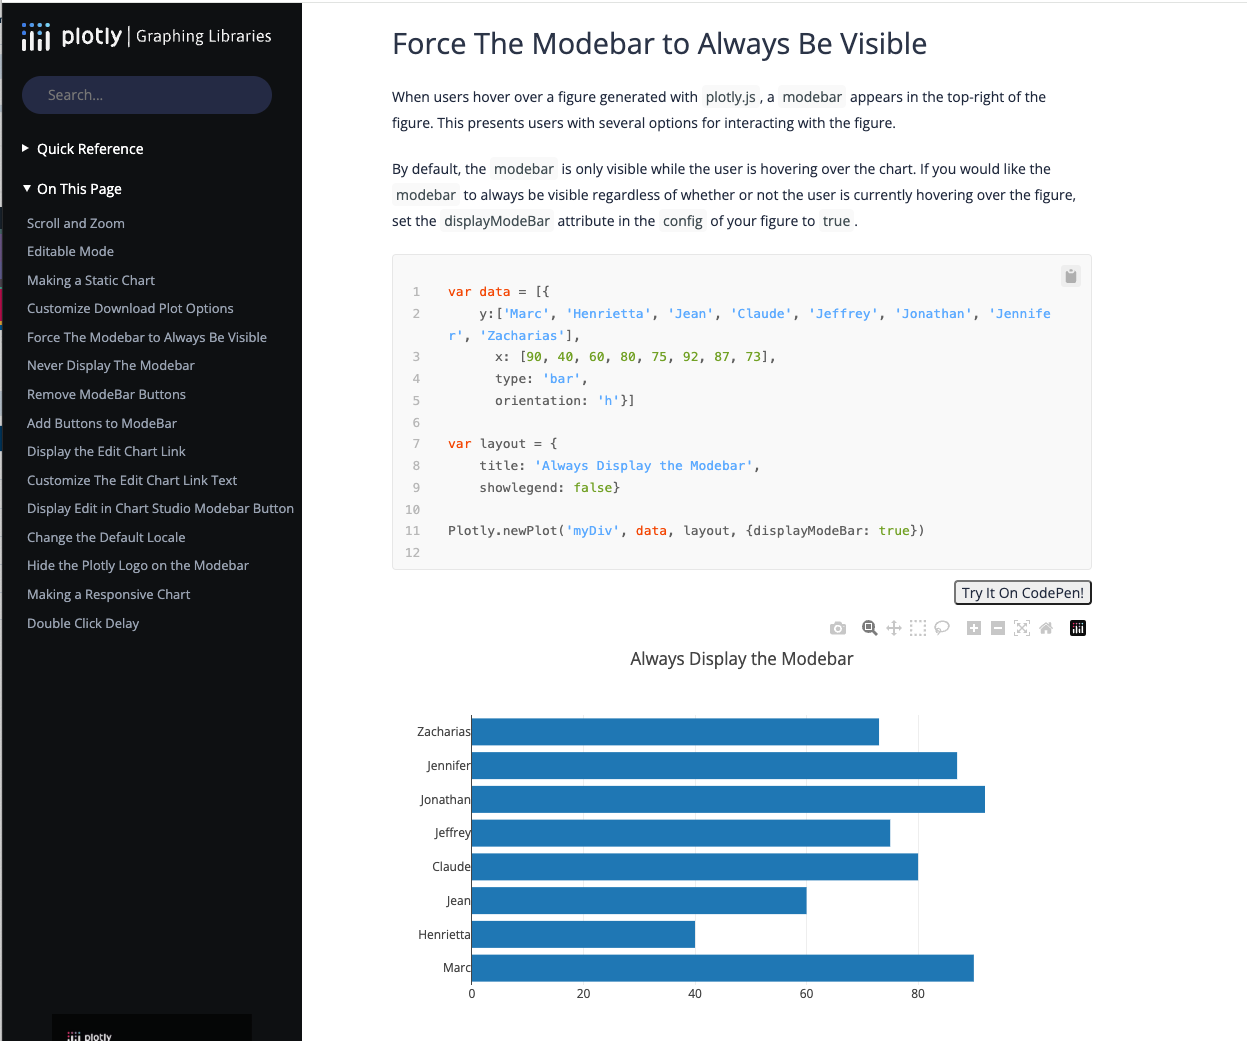
The {displayModeBar:true} I believe is the config object that I can't figure out how to "get to" in Retool.