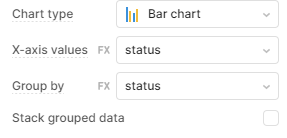
I created a bar chart by adding a dataset, but all the bars are the same color. Can I vary them?
I do not want to create a new dataset for each item.
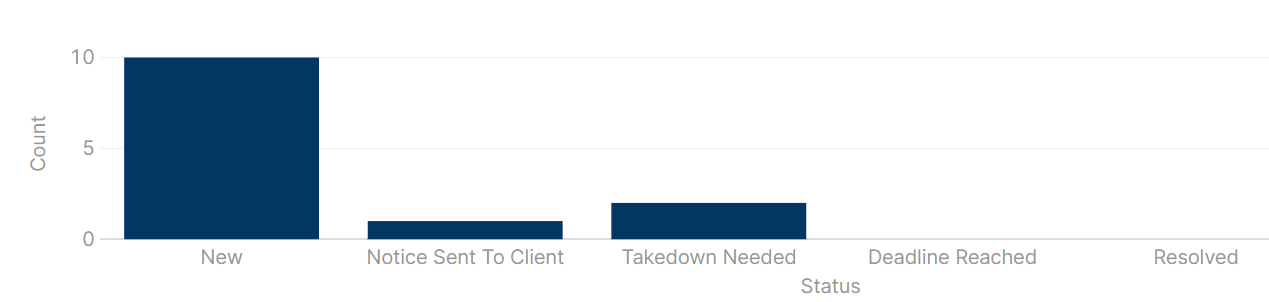
Dataset:
[
  { status: 'New', count: 10 },
  { status: 'Notice Sent To Client', count: 1 },
  { status: 'Takedown Needed', count: 2 },
  { status: 'Deadline Reached', count: 0 },
  { status: 'Resolved', count: 0 },
  { status: 'Taken down', count: 0 }
]