About a couple of hours ago, we started having issues where queries from all the databases connected to our system—PostgreSQL and MongoDB—are taking a very long time to run. There are no issues with the databases themselves, but this isn’t the first time we’ve had this problem in Retule over the past 6 months. For example, queries that used to take 3 seconds are now taking 30 seconds. Please let us know if everything is okay on your end—are there any technical issues with the platform right now?
2 Likes
Summary
On a Retool Cloud instance, queries against all connected databases (PostgreSQL and MongoDB) suddenly began taking far longer than usual (e.g. 3s stretching to 30s) starting a couple of hours before the report, with the same intermittent slowdown recurring several times over the past 6 months; the question is whether there is a current platform-side issue.
AI Response
Intermittent, cross-resource query latency of this kind has previously been confirmed by Retool as a platform-side higher-than-usual query latency incident rather than a problem with the databases themselves, so the live status page is the authoritative place to confirm whether an incident is active. In a closely matching prior case, latency and 'stuck/forever' queries spiked specifically when large batches of queries fired simultaneously, and a reliable mitigation was to reduce concurrency by firing fewer queries at once (batches of roughly 5 instead of large bursts). Beyond incident windows, reducing concurrent query execution on load and following the query optimization best practices in Retool's performance guidance helps limit the impact of these latency spikes.
Sources
Random queries running forever
A solved July 2026 thread where Retool staff confirmed a platform-wide elevated query latency incident affecting all apps, and a user reported that cutting concurrent queries down to batches of ~5 resolved the stuck/infinite queries.
Retool's App Performance Guide with affirmative best practices for optimizing queries and reducing concurrent query execution to minimize latency-related slowdowns.
The Community Team is testing out a new automation. Let us know if it's helpful (or not) by leaving a  ,
,  , or
, or  . Or by marking this post as the "Solution"! Let us know if you have any feedback here.
+1 Here. Cloud instance. We’re primarily seeing the slowness in Retool DB, but also occasionally on Supabase calls.
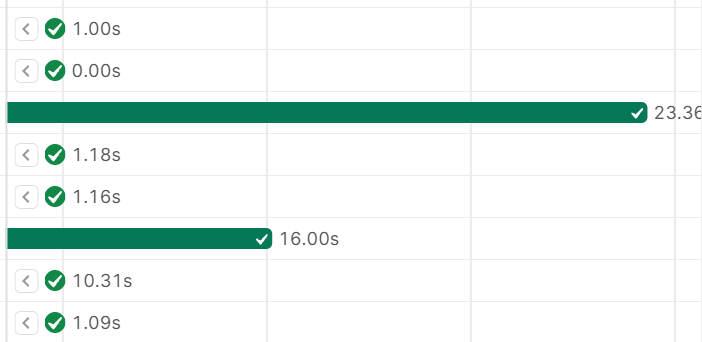
We started noticing slowdowns in our environment yesterday afternoon, and we’re still seeing them today. Queries that are usually sub 1 second are taking 20+ seconds. In the attached screenshot, the 23.36s response is a Retool DB SELECT query for a table with 7 columns and ~50 rows.
Any help would be appreciated!
as of a few hours ago we’re seeing severely degraded response times on regular REST API resource calls, but nothing specific to DB calls that i’ve noticed.
so, potentially a wider resource issue?
The problem is not with connected databases surely, even 1 query to Retool DB is very very slow.
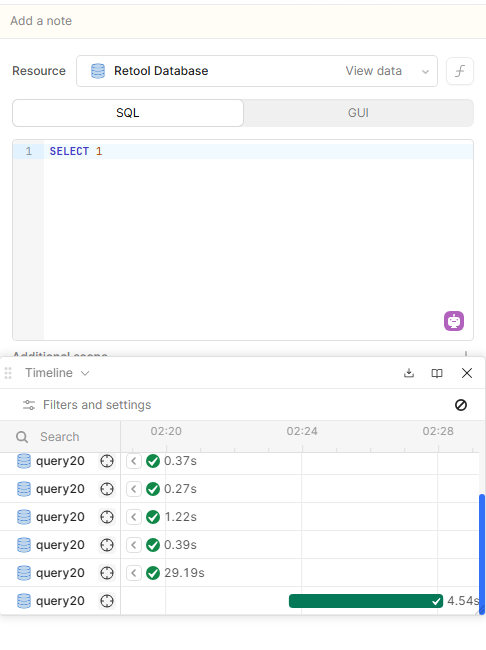
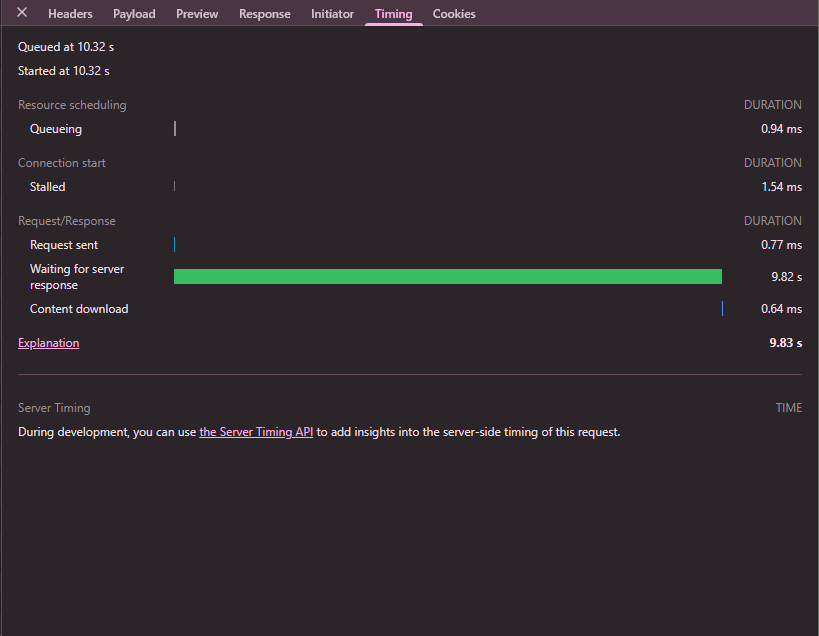
+1, we're seeing the same. Retool DB queries are intermittently taking 10–45s. A simple SELECT 1 took 29s while I was verifying, with other runs of the same query under 0.5s. Retool's timing shows execute resource ~30ms against 39–46s of "transfer data", and DevTools on another affected query shows 9.8s waiting for server response with near-zero queueing/send/download, so it seems to be server-side, not the query or the client.
1 Like
Hey everyone, thank you for flagging this! We have kicked off an internal incident and are investigating. Please check here for updates, and we will also share updates in this thread as we get them. Thank you for your patience!
2 Likes
Hi @cperea ,
Do we have an eta on this? I have clients that are starting to complain today. I noticed latency yesterday and previous days but not this bad.
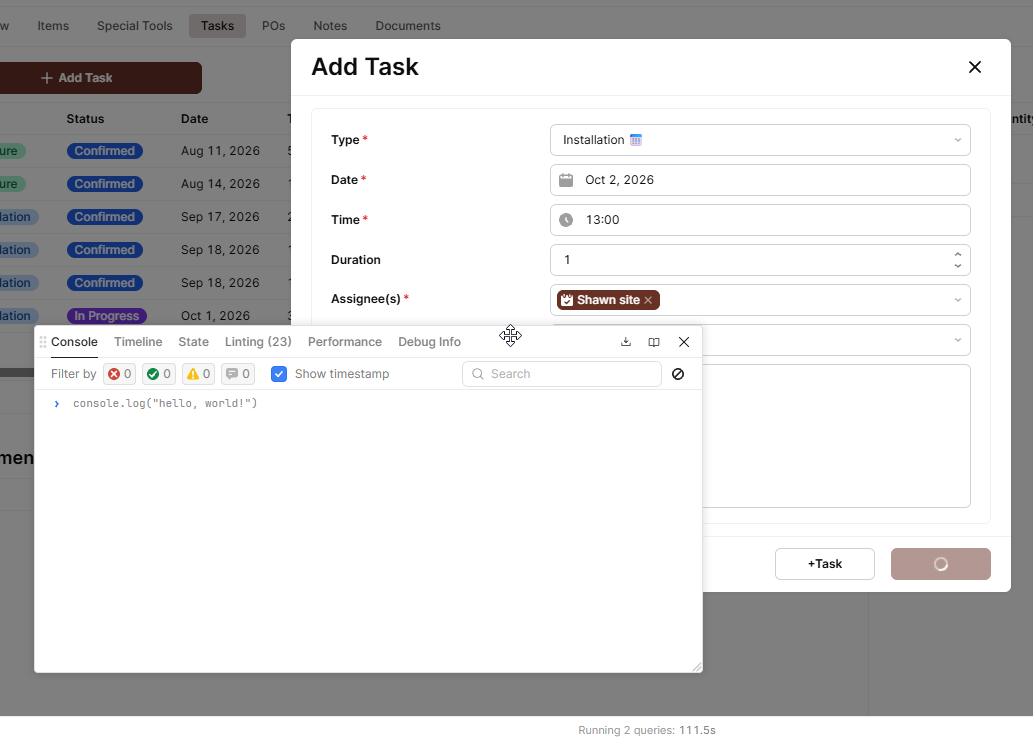
This very simple insert query has been hanging for over 200 seconds!
Hey @Shawn_Optipath , we have a fix out now. Can you try testing this again and let us know if your queries are back to normal? Thank You!
Thanks for the update, @cperea. Unfortunately, it is not yet resolved on our end . I have reloaded the app and tested several times since your message:
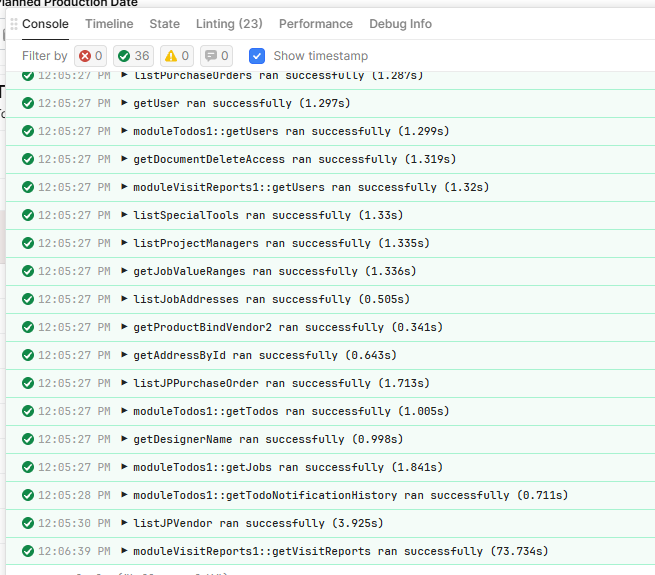
- First load: one query was still hanging after 73 seconds .
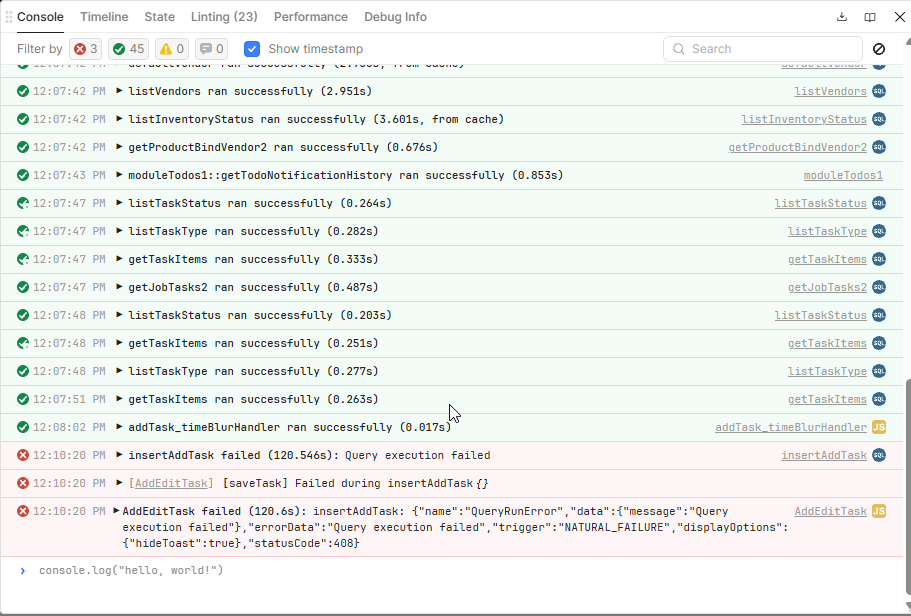
- Next load: the slowest SELECT query completed in approximately 3.6 seconds , but attempting to add a task caused
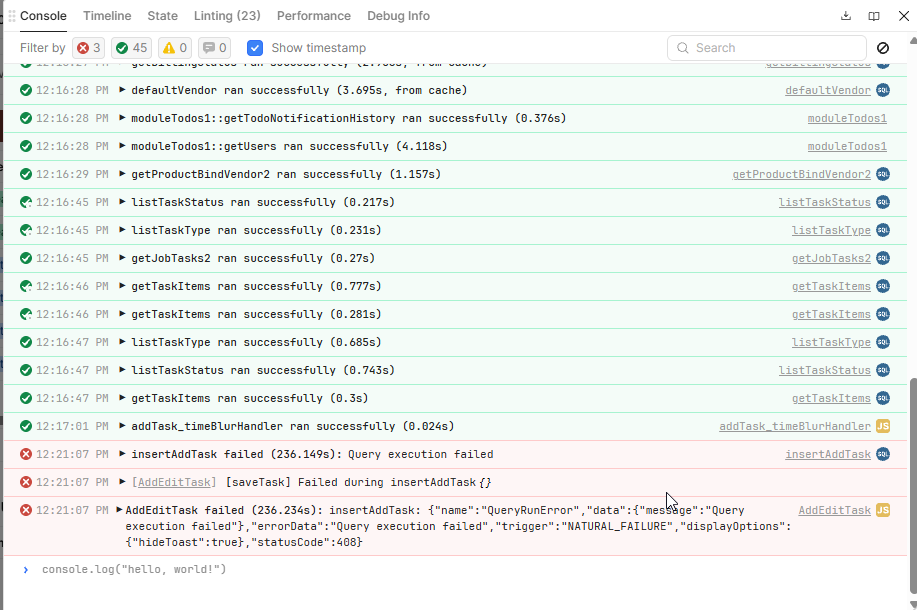
insertAddTaskto fail after 120.5 seconds . - Another reload: the slowest SELECT query took approximately 4.1 seconds , and
insertAddTaskfailed again after 236.1 seconds .
Both insert failures returned status code 408 . Screenshots below.
Some read queries appear to have improved, but users still cannot reliably save tasks , so this is more than residual slowness. As mentioned earlier, SQL Server has been responding quickly in SSMS.
I appreciate the team working on this, but I’m honestly very disappointed. I build and maintain production applications for clients, and these issues are disrupting their day-to-day work. Clients are already raising concerns, and understandably, they come back to us when the systems we have delivered become unresponsive.
I also want to raise the broader concern: it is difficult to feel enthusiastic about the push toward the new app builder when the platform our existing clients depend on is struggling with basic operations. Innovation matters, but reliability is what allows us to recommend Retool and confidently build long-term client systems on it.
Could you please confirm whether the fix has been fully rolled out and whether these remaining failures are still being investigated as part of the incident? We also need guidance on any safe workaround and an expected recovery time—or, if that is not yet known, when we can expect the next update.
Once this is resolved, an explanation of what happened and what is being done to prevent it recurring would help rebuild confidence.
reports from our internal users that the performance feels back to normal  (hoping the same for the rest of this thread!)
thanks for helping this get addressed so quickly, @cperea !
Hello, your fix helped, but not at all. Queries runs faster, but still slow. For example - the query that was running in 3 seconds now running in 10 seconds. Not 30, like it was on Friday, but still to slowly. Pls, fix it