I noticed that since the beginning of September all retool db queries take much longer to respond. The default 10 sec time out used to be enough but suddenly all my users raised support requests because they were facing repeated time outs. I am now going through all apps and workflows to increase the time out (which is pretty painful) but I am worried that all processes will now become slower by these extended response times.
I am using cloud-hosted Retool version 3.271.0 on Business plan.
I am wondering if you are experiencing the same and if you or the retool-team can share some background on why this is happening and if it is something temporary.
I haven't noticed it, because I don't use the Retool DB, but I believe that in general Retool recommends you don't use the Retool DB for production workloads.
It's pretty simple to switch over to a cloud DB in my experience (I use Postgres DBs on Azure), for what it's worth.
Hey ChiEn, the degraded performance of retool db persists making all retool apps less useful due to the long waiting times. Do you have any insights to share, why this happened and when it will be fixed?
hi there! I'm just curious if you've noticed increased query times if you run your queries using PGAdmin or from the Retool Query Library as well or if you've only noticed the problem from queries ran from an app
Interesting point! Thank you for looking into it @bobthebear. Indeed the queries ran like before when I execute them in the query editor. So the workaround would be to set up each query in the library and then trigger it from the app? It still does not solve the issue and makes working with retool slower.
well, to be honest, the problem could be coming from many different places, so I was just trying to think of different ways that might test or at least rule out a few of them. it could be how the query is called/used or what it does or uses, or something server side (from config issues w things like database sharding to regional baremetal server issues) or client side (some wiring in the background got corrupted and isn't able to fix itself.... usually things like this are solved by deleting a component or query and remaking it).
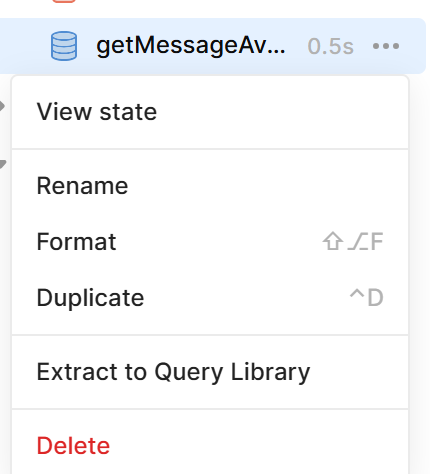
to your point on being slower, you can actually make queries in the app then use the 'Extract to Query Library' function by clicking the 3 dots ...
so you don't have to manually copy-paste everything
but since the query runs fine from the Query Library, it'd suggest the frontend is being slowed down. Is this an App that's been steadily growing? There might be too many queries running at one time or too many components needing updating/rending while maintaining multiple queries running at once can bog things down. I don't know if it would solve this, or just help in keeping track of what's slowing things down, but have you tried extracting the query and components that use it to a separate module or pages into separate Apps (this would let you run certain sections separately to judge their speed under perfect conditions then you can comapre how the app runs with and without sections and how those sections run outside of and inside an app.
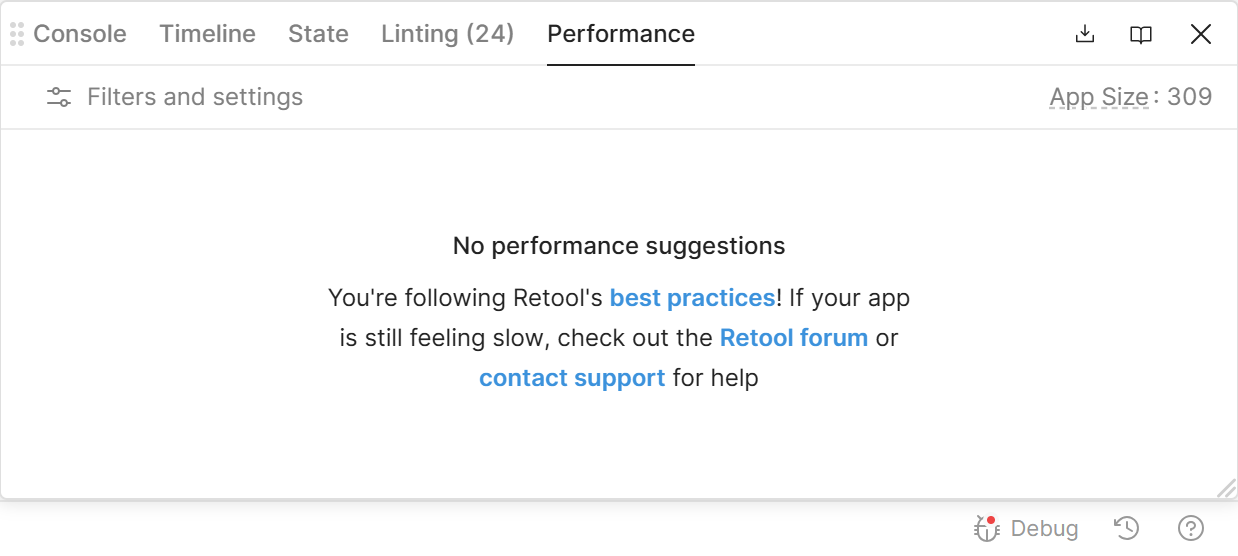
also, have you checked the debug/performance window for any hints (bottom right corner while you're editing an App or Module)?
Hey @Ody, I agree with @bobthebear. Thanks so much for the detailed analysis. In addition, I was wondering if you have a lot of transformers defined on those queries as well? Would you mind sharing an export of your app so I can take a closer look? Thank you!
Also, @Ody, if live debugging help would be useful, we have Office Hours session going on right now until 3pm EST where you can get help directly from the Retool team and other developers. We host these Office Hours twice a week!
Thank you @ChiEn and @bobthebear . These very slow queries were happening also on workflows, but then somehow thing became faster again without any change from our side.
Hey @Ody, checking in to see how things are going on your end! I wanted to circle back to your RetoolDB. From what we’re seeing, it looks like your RetoolDB has been under heavier load. This can happen when queries get longer running or less optimized, or if there are more concurrent users and queries hitting the same resource. If your workflows also rely heavily on this RetoolDB, that could explain why you’re seeing slowdowns there too.
We reviewed your metrics and you’re not hitting any memory limits, which is great. However, you do have a larger query that averages around 40 seconds. As more records get inserted, queries like SELECT or COUNT will naturally slow down since the dataset keeps growing.
Our current Neon settings only store 1 to 2 days of metrics, so we cannot see September and October, but they might have been particularly busy months for your dataset?
Retool Database is designed to be a convenient way to store data to use within or outside of Retool. It is not designed to be a highly-available, scalable database service, and you should use a separate managed database provider if your use case requires these guarantees.
Hey @Ody happy new year Just checking in to see how you’re doing. Were you able to take a look at my response above? Let me know if you need more help!
Hi ChiEn, thank you for your response and checking in on that. It makes perfect sense that retoolDB behaves like other DBs regarding their performance based on the queries run against them.
However this did not seem to be the case when I raised that issue. Trying to find out what happened performance wise some months ago would be a waste of time for all of us.
I understand that I relied too much on retool’s db and will use different providers and tools for serious use cases next time.
Thank you all for your time on supporting me on this matter. Very much appreciated!