Public service announcement to anyone who's not used the Debug console and performance tab before and big thank you to the Retool dev team that put this in place.
Problem
An existing app was suffering from a drop in performance despite no major changes being made and data volumes being the same.
The app itself hadn't changed for a few days - the last change had been to take an existing lookup and edit container and turn it into a module, which should have been a performance boost, if anything.
Reverting the app to the previous release fixed the problem so I could conclude it probably wasn't the database.
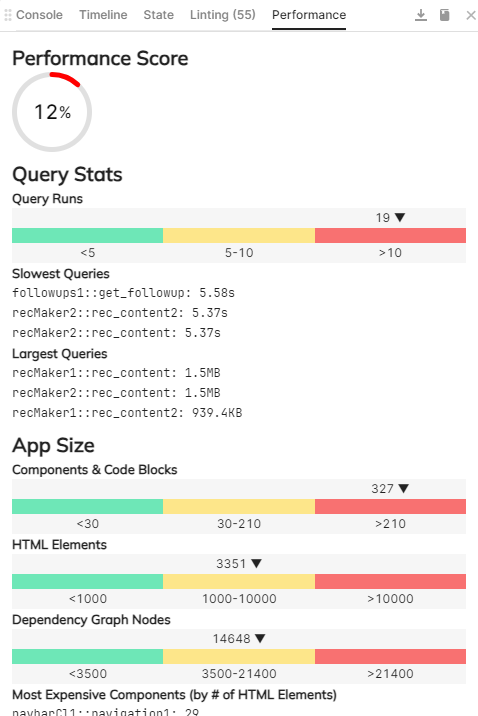
Spent an afternoon wondering why the addition of a module would cause such an impact and then noticed the "performance" tab on the Retool debug console.
Immediately I could see where the slow queries were and also gave me a big clue as to why they were slow.
Solution
More importantly - I could instantly see that my module was needlessly making the same call in each instance of the module and I could improve/cache that query.
Worse yet, there was a query being run from the module that it shouldn't even have been making as it was data unrelated to the module.
Checking my module code I discovered that when I'd separated it from the app I'd accidentally included another form inside a hidden modal panel that was firing its own set of queries.
I'm sure I would have found this eventually but this one panel saved me about a day of debugging "fun"
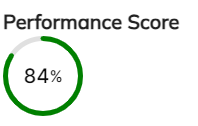
Happy to say the app is now back on track and working better than ever:
Conclusion
Use the debug console that Retool provide, it can be really helpful!
Thanks for the PSA @dcartlidge, we really appreciate the feedback and detailed writeup!
One more pro tip: the "Linting" tab now has a bunch of performance lints. It points out slow/large queries, tables/lists with lots of data and old components which would benefit from an upgrade.
Linting would be great... if it worked properly.
However, at this time:
it doesn't support additionalScope and "imported query variables" - it reports those as errors
it has some curly-bracket counting issues sometimes
it generally recommends "pagination and caching" on queries it thinks are slow, regardless of those already having caching, or returning 1 record (also, it seems to count the network latency between Retool cloud and the database it queries as part of the query performance)
I've been using this for the past week and it has helped me a lot to improve performance of several apps.
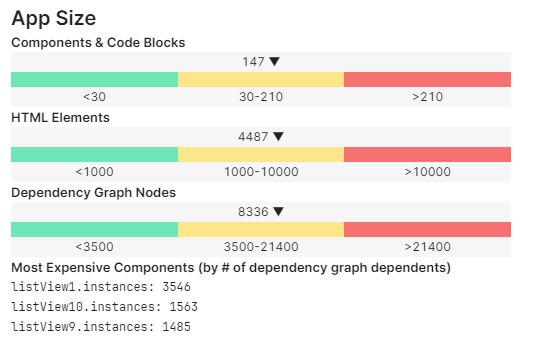
I'm jealous about dcartlidge's 84% indicator as I haven't been able to reach that point. Mostly because of HTML elements and dependency graphs. Example:
Not sure if there is a way to improve listViews and if a score between 55% and 75% is worrysome or not.
@Eshed_Gal-Or all good pieces of feedback. Point 3 is part of what I was referencing in my comment above. I'll think about how to better provide suggestions in these scenarios.
@MiguelOrtiz glad to hear this tool has been helpful!
I wouldn't worry too much about the absolute score, an app can still be performing well with a score in that range.
For listviews in particular, we've recently shipped a new version of the component which has much better performance (it has built in virtualization). If you haven't upgraded yet, I'd recommend doing so.
Short answer, lazy loading of queries, more modules that only run when they're activated, split out the main app into smaller apps
I have noticed that the initial "performance" score drops after initial load when you start interacting, though - the "startup" score might be higher but every query run or component that gets added (dynamic things like listviews etc) start to bring the score down.
Ultimately I treated this as a guide for improving the app and wasn't focussed on "raising the score" as such, but it definitely helped me find where I was making unecessary calls and loading components that could be optional or in a module.
Ultimately I treated this as a guide for improving the app and wasn't focussed on "raising the score" as such
Yes, this is the correct approach. The score isn't as rigorous as something like lighthouse yet. It uses the query stats/app size gauges and linearly interpolates between Retool p50 and p95 values. ie: if your app is better than 50% of all retool apps =>perfect score for that section. Worse than 95% of retool apps => 0 score for that section.
has the Performance tab made it to the on-premise releases, yet?
Yes, the first version of it is available in 3.24, but it's behind a feature flag. Email me (petera @ retool.com) with your org details and I can enable it if you like.
The performance tab shipped fully (no feature flag) in version 3.33.