A colleague reported a query timeout. I was able to reproduce the problem but that query has been rock solid for months. I ran the query in SQL Server Management Studio with no trouble.
I was poking around when the query ran again (on a refresh timer) and that time it returned data. I was thinking "Retool weather" and asked my colleague to check again. He reported it still fails.
I want back to my IDE and it failed again for me as well. It's not a heavy query; in SQL Server Management Studio it returns 104 rows in 2 seconds. The Retool error is
* statusCode:408
* error:"Request Time-out"
* message:"Query timed out after 120000ms"
* data:null
The underlying resource is an SQL query to an Azure database. I just ran it again and it succeeded this time:
select_portfolio ran successfully (104.969s)
While it was running (and I assumed it might timeout) I tested a "simpler" query against the same table: SELECT * FROM dbo.[skill-editor-portfolios]. Running inside Retool that returned quickly. The more complex query, which involves a join with another table, is the one which is timing out. However, as noted, it runs in 2 seconds in a local copy of SQL Server Management Studio. So I doubt the underlying cause is really time/complexity.
I just ran it again "successfully" but it took 102 seconds. Is Retool having any known issues right now?
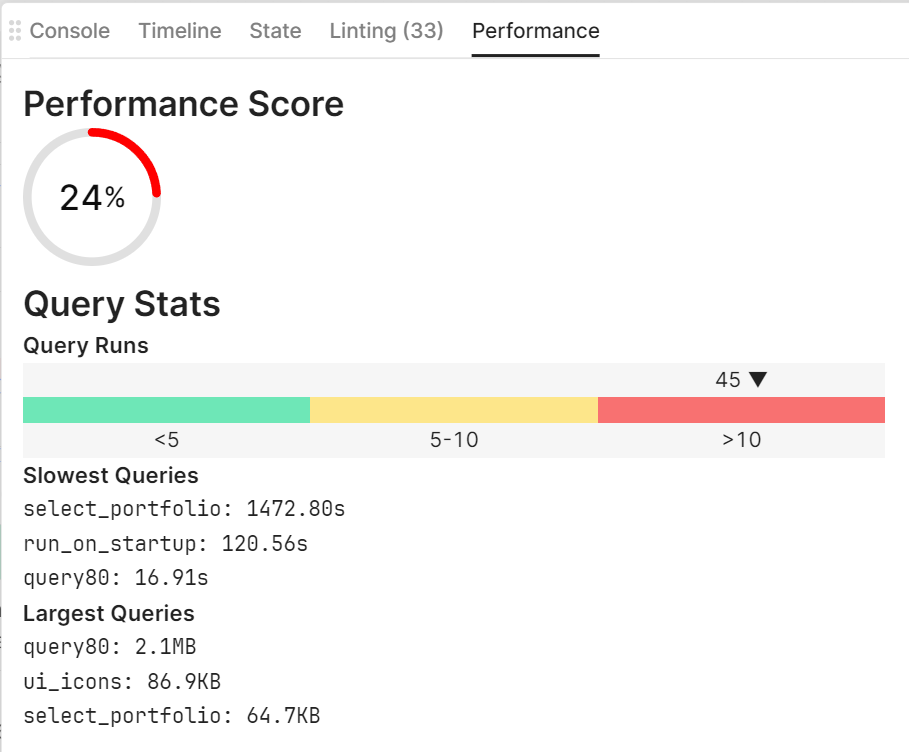
Still exhibiting the same problems this morning. Here is some interesting data:
select_portfolio is the query in question. It's taking over 100 seconds per execution; occasionally over 120 in which case it times out. But notice that it returns a small amount of data.
Meanwhile my test query80 returns more data but isn't close to a timeout.
Neither query takes long running inside Server Management Studio. As a test I changed the only parameter to the query (a tenant ID) which causes it to return a different set of data. I switched to a tenant which returns 1,329 records instead of 104 records. In Server Management Studio it took 6 seconds, in Retool I got the error "Query timed out after 120000ms".
I duplicated the query in question and the duplicate exhibits the same behavior. The difference is that select_portfolio output is displayed in a table component and select_portfolio2 is not used by any component. I was thinking that the loading of the data into a destination component might be a factor but select_portfolio2 performed identically to select_portfolio.
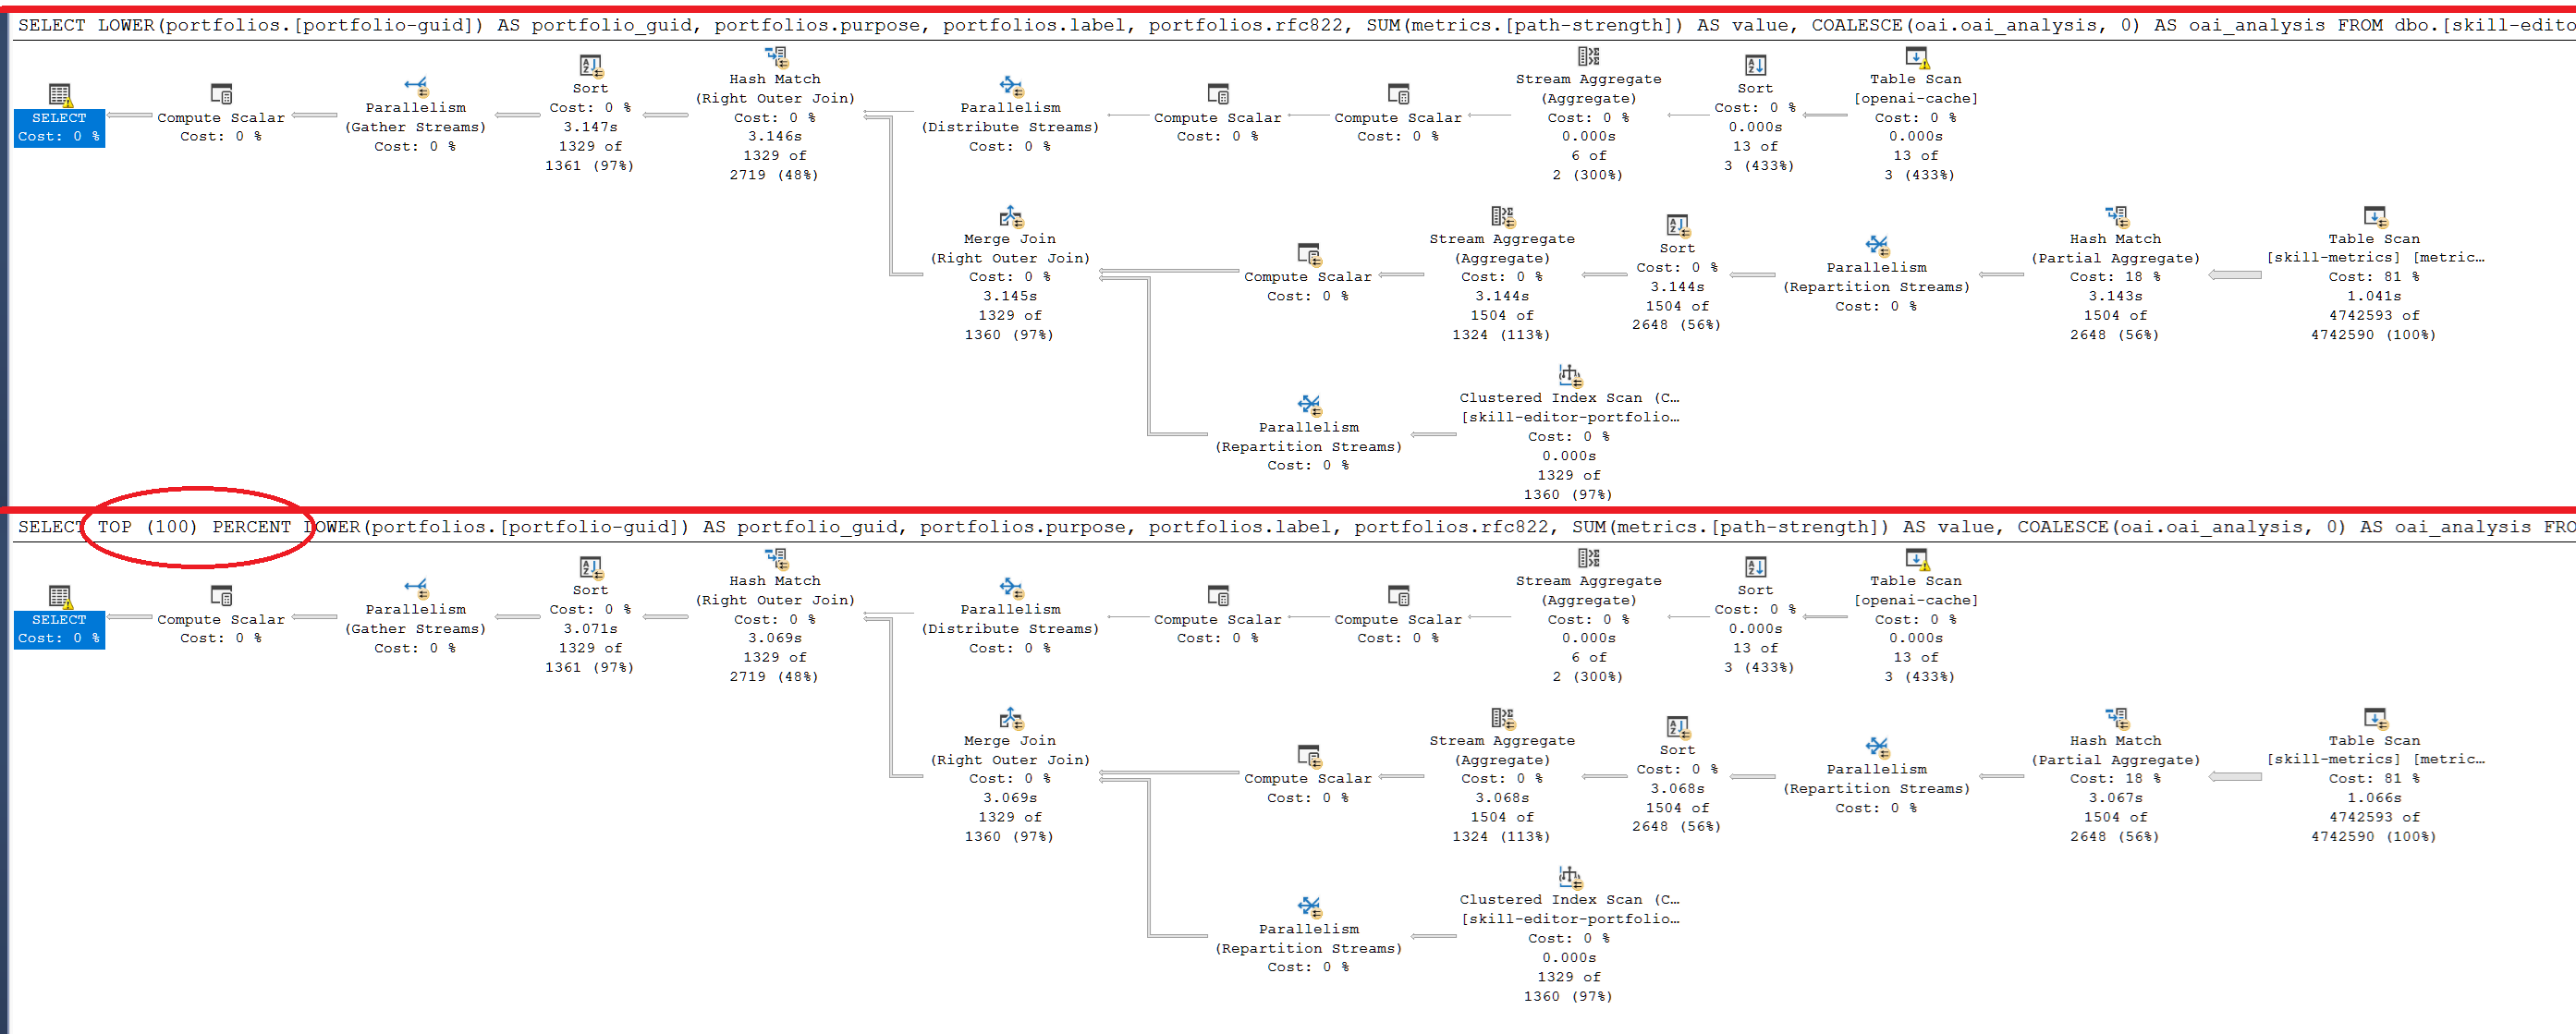
I think I have found the problem. The query in question had begun with:
SELECT TOP (100) PERCENT
        foo, bar, gag....
Removing the TOP (100) PERCENT has returned the query to normal performance.
Now of course the clause should be a no-op. And indeed, when Server Management Studio talks directly to SQL Server it seems to have no effect. The figure below shows the actual execution plans for both flavors:
So my best theory is that sometime yesterday Retool made a change to the pipeline between a Retool SQL query and the remote SQL server. Perhaps there is some ORMish library in that path which can refactor a query in some way that disturbs performance?
If Retool wants to investigate this I will supply the actual query. If the Retool ORM rewrites the query in different ways depending on the presence or absence of a TOP (100) PERCENT clause it would be interesting to see what it is doing exactly.
Note that when the TOP (100) PERCENT is present, the results do sometimes complete in < 120 seconds and in those cases the results ARE correct. The only reproducible behavior difference seems to be a drastic change in performance.
I have investigated this at the Azure SQL database end. The Query Performance Insight tool allowed me to isolate the queries in question. I can see the long durations for the TOP (100) PERCENT versions and the short durations for those where that is omitted. I can also see some test queries where I ran the TOP (100) PERCENT version in Server Management Studio and those ran fast. Only the ones from Retool are slow but the query text I see in the Query Performance Insight tool is the same so there is no rewriting of the query being done by Retool that is causing anything to be slow. And it is difficult to imagine that the presence of specific SQL syntax would affect much of anything in the plumbing. Of course Retool is using some sort of library to connect to the SQL Server and Server Management Studio is no doubt using something different.
Another question would be what is the Query Performance Insight tool actually measuring as the start and end time? If the real run times for both query versions were the same, and the underlying data payload was the same, but Query Performance Insight logged a query as being "finished" when the rows are delivered back to the client endpoint...that could explain different numbers.
Hey @Roland_Alden, thanks for the detailed write up on this issue. We've submitted a report to the engineering team responsible for resource connections so they can investigate. We'll update you here as we find any new information to share.
This is happening again. Or I just happen to need to access a large dataset at the moment.
TOP 100 is not the issue.
The query returns in 4 seconds using Server Management Studio.
The query times out after 120 seconds in Retool and I see I can no longer change that to 240 seconds. 
However I noticed that I was hitting 100% DTU (Azure) for the entire duration of the query. I doubled my spending and Retool query times went back to ~3 seconds.
There are definitely times where I have been hitting 100% but they are rare so now I'm paying more for headroom I don't need 99% of the time. But....at least it works.
I notice this:
Meaning Retool does have some "Azure specific" code in this path. If Retool could (dynamically) detect DTU utilization during a query and "relax" the timeout metric as it approaches 100% that would be "nice".