So we are an ecommerce company building order management in Retool, by far our biggest app as there is a lot of handling requirements.
I'm always trying to split apps up when possible, but this app is already only containing what is really needed for handling orders in Customer Service.
The problem is the the overhead introduced by Retool on queries seem to scale really bad with the app size / amount of total queries that exist in an app for some reason.
I've already optimized the app to trigger queries manually everywhere, so it's not the issue that we are triggering too many queries at once, but one query simply takes longer to execute depending on the total app/size / queries created in the app it seems.
Breakdown of response times for a critical simple SQL query to a resource:
Directly executed towards DB: 16 ms
Inside an empty app with 1 query: 400 ms
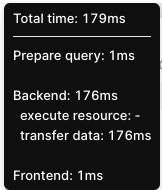
Inside our order management app: 3000 ms
This is without any references or success/failure handles, just raw TTFB from the Retool backend.
Any ideas on what is going on behind the scenes, and what to do about it?
it's an annoying solution, but if you use JS resources/queries you should skip most of the overhead you're seeing. 400ms is a lot though, I think the docs state an average of 150ms/query so part of me is wondering if the issue is where the SQL db is hosted. i'm a bit curious, have you checked the Network tab in the browser dev tools to see if a query is actually failing (maybe connection issues?) and subsequently being retried over and over? the difference between 400 and 3000 is nuts like there's a hashtable in the background for lookups thats constantly getting collisions or, more likely, whos load factor is out the roof.... O(1) is great, as long as it's more efficient than something at O(n^2) or in this case something w O(n!) lol
Do you have any scripts/transformers running against the data after it's fetched in your example?
At a large enough scale I think you're better off moving away from direct DB queries/transformers and setting up an API that handles the business logic and initial data transforms. Trying to run a bunch of JS in the browser on large datasets to do what a server normally does isn't scalable.
It's a raw test query with a very simple SQL payload to the resource.
it's totally isolated, meaning that in both apps it's not used / referenced, or doing anything else in terms of transformation or success / failure handles.
I'm really interested in what causes this massive overhead spike in the Retool backend TTFB.
Anyone from Retool willing to pitch in here and maybe have a look?
Hey @Martin_Christiansen! Thank you for starting this discussion. I synced with the Retool team working on performance and have a few questions for you if you don't mind.
Could you clarify what you mean by “raw TTFB from the Retool backend”? Would also be helpful to know how you're measuring it!
Are you Cloud or On-Prem? And if On-Prem, what version?
Can you provide a screenshot of your query run metrics in each of the three tests you ran?
And just in case this is helpful for you or anyone else reading this thread, here's a link to our docs about the query run metrics!