In a stacked bar chart, I have created categories in the wrong order:
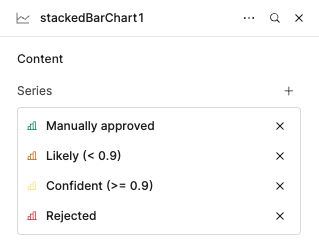
And now I want to reorder them.
A simple drag and drop would help.
In a stacked bar chart, I have created categories in the wrong order:
And now I want to reorder them.
A simple drag and drop would help.
Hey @Amit_Moryossef , welcome to the Retool community!
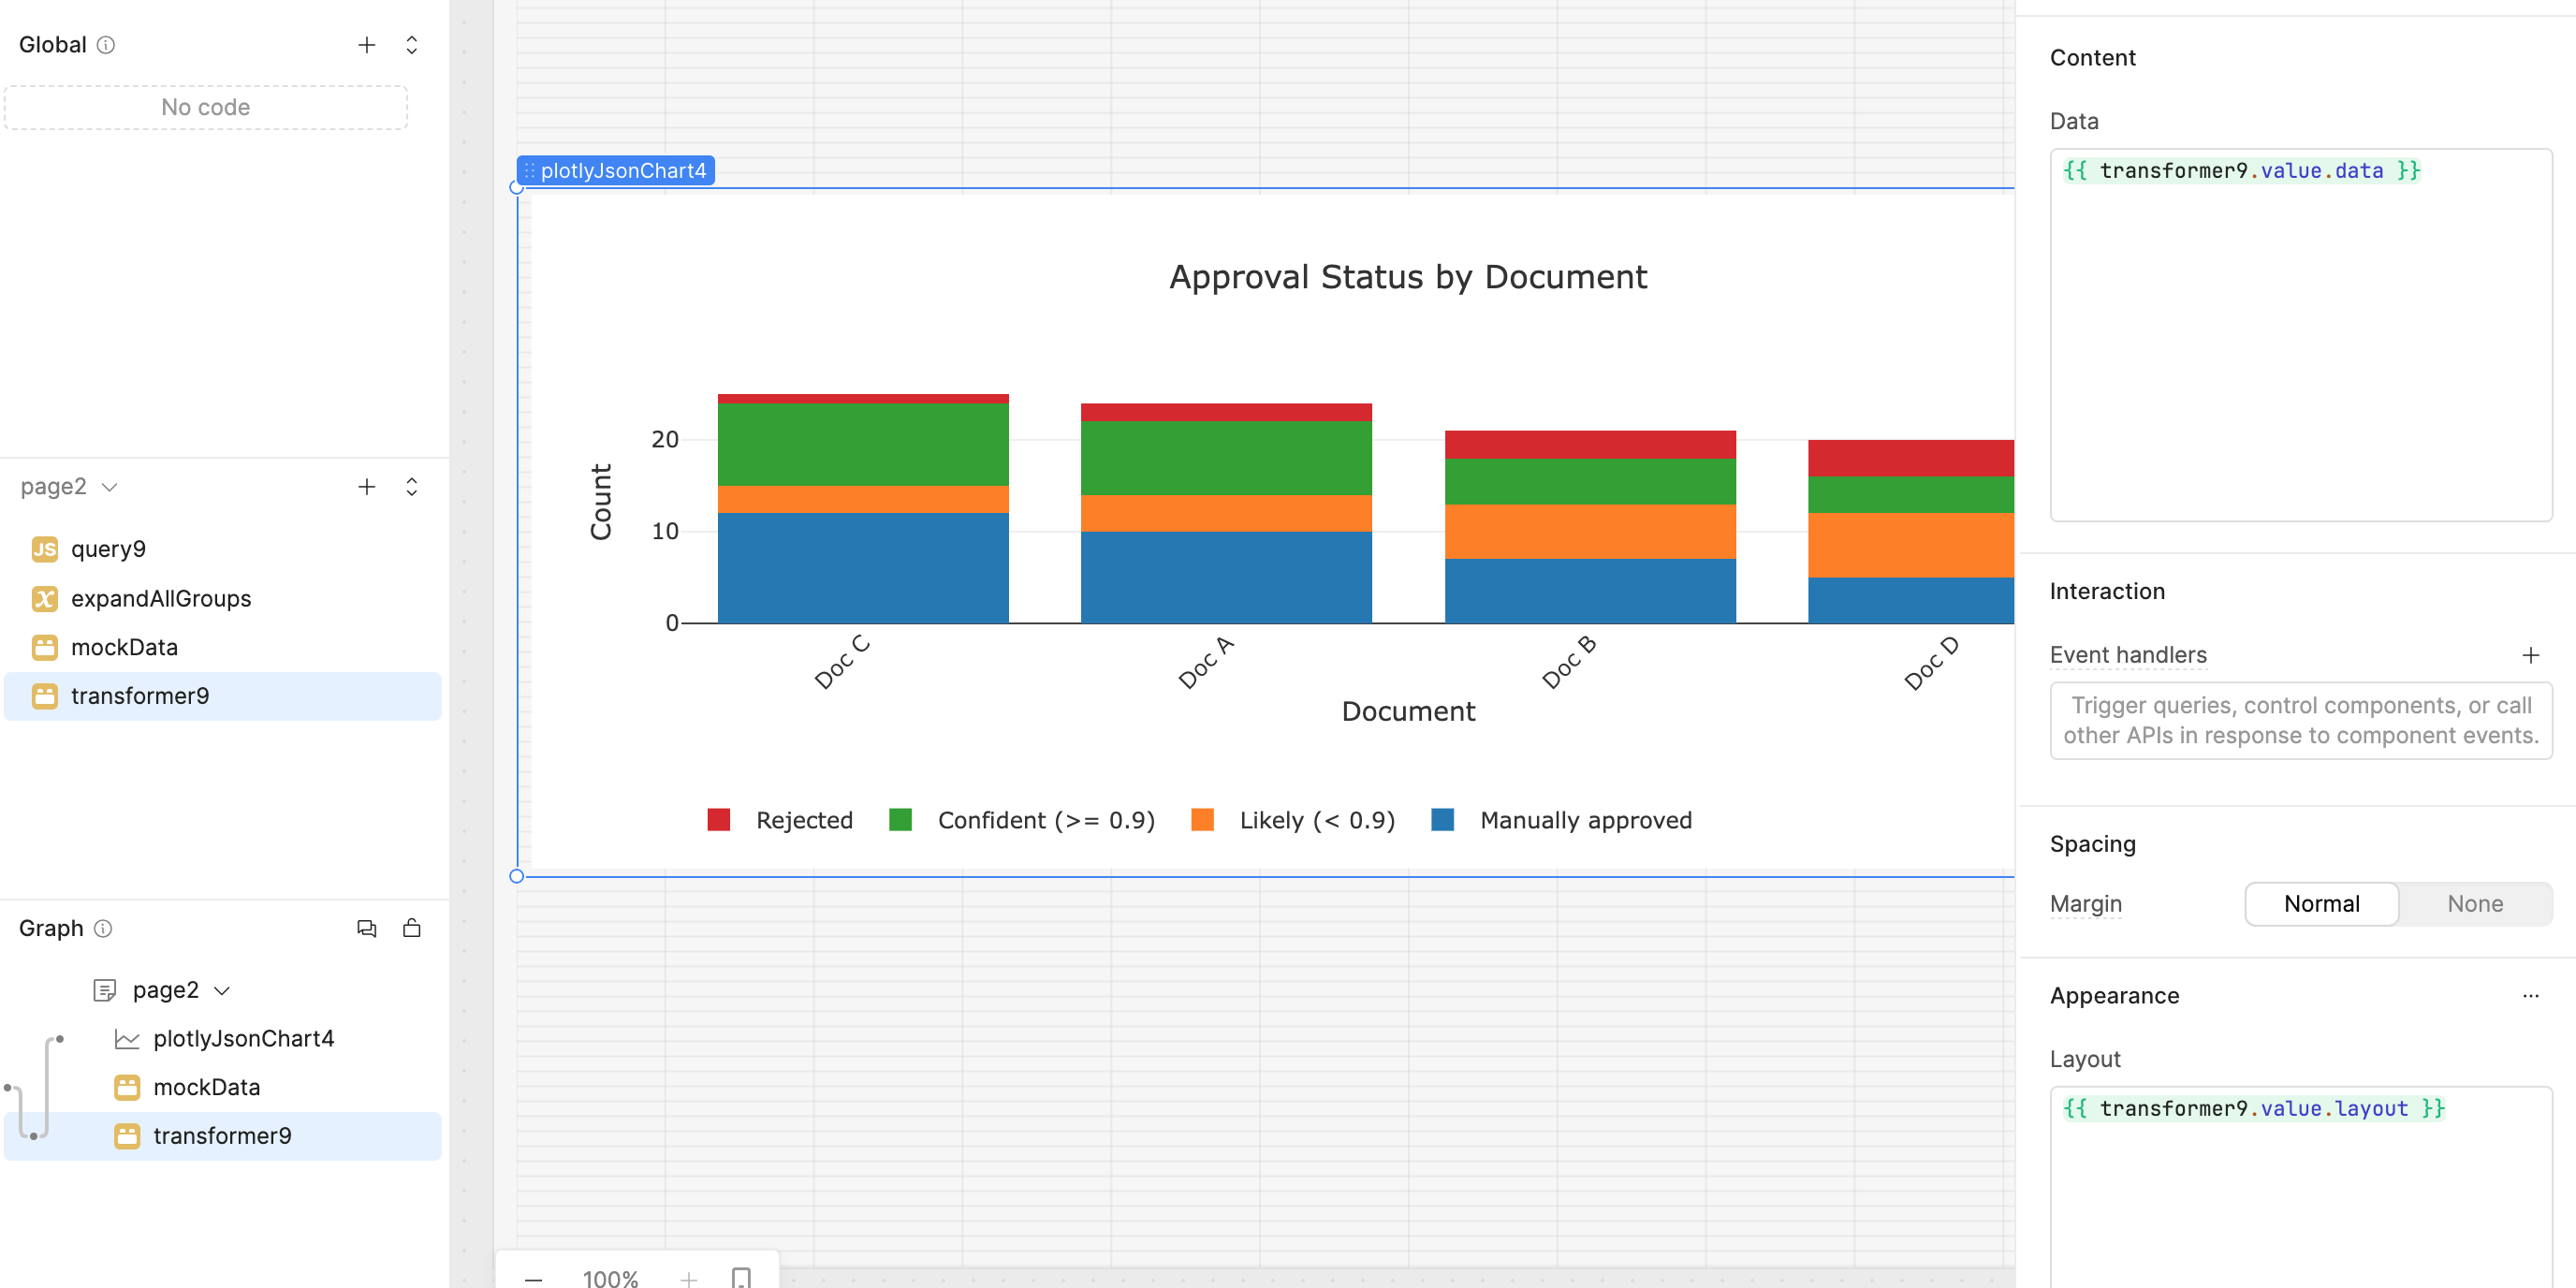
I understand your requirement, and you're right — the default Stacked Bar component in Retool doesn't currently support the level of customization you're looking for. However, there's a great alternative using the Plotly JSON Chart component, which gives you full control over chart behavior and appearance.
Here’s an example you can try:
Mock Data (sorted by “Confident (>= 0.9)” descending):
const data = [
  { label: "Doc A", "Manually approved": 10, "Likely (< 0.9)": 4, "Confident (>= 0.9)": 8, "Rejected": 2 },
  { label: "Doc B", "Manually approved": 7, "Likely (< 0.9)": 6, "Confident (>= 0.9)": 5, "Rejected": 3 },
  { label: "Doc C", "Manually approved": 12, "Likely (< 0.9)": 3, "Confident (>= 0.9)": 9, "Rejected": 1 },
  { label: "Doc D", "Manually approved": 5, "Likely (< 0.9)": 7, "Confident (>= 0.9)": 4, "Rejected": 4 }
];

// Sort by "Confident (>= 0.9)" descending
const sorted = [...data].sort((a, b) => b["Confident (>= 0.9)"] - a["Confident (>= 0.9)"]);

return sorted;
Plotly JSON Chart Transformer:
const raw = {{ mockData.value }}; // Use sorted data

const categories = ["Manually approved", "Likely (< 0.9)", "Confident (>= 0.9)", "Rejected"];
const x = raw.map(d => d.label);

const traces = categories.map(cat => ({
  name: cat,
  type: "bar",
  x,
  y: raw.map(d => d[cat]),
}));

return {
  data: traces,
  layout: {
    barmode: "stack",
    title: "Approval Status by Document",
    plot_bgcolor: "#ffffff",
    paper_bgcolor: "#ffffff",
    font: { color: "#333" },
    xaxis: {
      title: "Document",
      tickangle: -45,
    },
    yaxis: {
      title: "Count"
    },
    legend: {
      orientation: "h",
      y: -0.7
    }
  },


  config: { responsive: true }
};
Sample Output:
Thanks! this would indeed solve my issue, but it feels like using a tank when a simple bullet would do. just the ability to change the order of the series.
I'd like to avoid writing custom code as much as possible, that's why i'm using retool.
The easier solution would be to delete my series, then add them again one by one in the correct order
Hi @Amit_Moryossef, there is an existing feature request for dragging and dropping series in charts, so I went ahead and added a +1 for you. Unfortunately deleting and recreating them in the preferred order is the way to do it for now.
@WidleStudioLLP is right, however, that Plotly JSON charts are the most customizable.