Background:
I have an SQL query that pulls a list of companies the current user has access to. User permission table joined to user table and company table.
Each table has ~5 columns and ~7 records, so light tables.
Postgres DB hosted on Neon, like Retool's own resources.
Problem:
Running it via a SQL client takes at most 300ms. Typically sub 100ms.
However running the same query via a Retool app takes at least 1.5 seconds or longer.
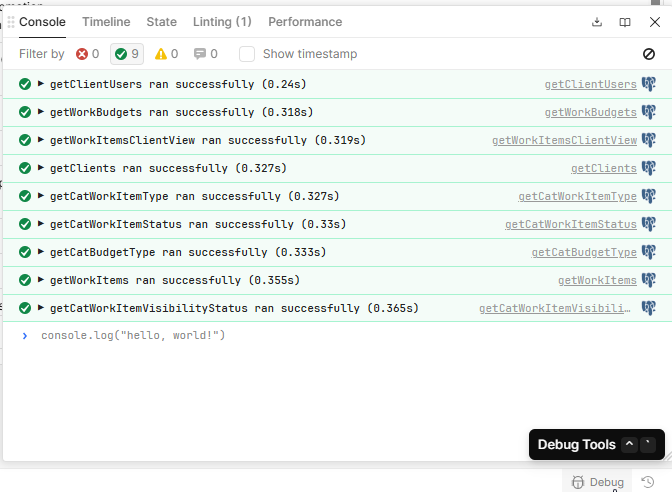
The query is set to run on page load and triggers other query/code on success.
Any clues why this could be taking so long to execute in the app?
Is it a matter of datacenter location between my DB and Retool..?
SELECT company_id,company_name
FROM role_users ru
LEFT JOIN users usr ON ru.user_id = usr.id
LEFT JOIN companies c on c.company_id = ru.company_idp.permission_id
WHERE usr.retool_user_email = {{ current_user.email }}
ORDER BY company_name
;
I experienced the same thing when moving from the Retool db to Neon. Neon uses a "serverless Postgres" model where storage is always-on, but compute (the actual running database engine) can be paused ("autosuspended") when idle. On the first query after sleep, it spins up the compute instance — and this can take 1–2 seconds (sometimes more). They call this “cold start latency” — very similar to what you see with AWS Lambda or Vercel serverless functions.
Autosuspend timeout: You can configure this (e.g., suspend after 5 minutes idle). I believe you can change this but only in Enterprise.
If this is your case and you do not have enterprise at Neon you could as a workaround perform a small query on page load and have a splashpage or modal with "loading".
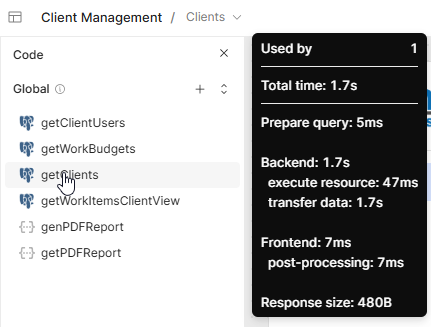
Here is my query getClients running after being idle for over 5 minutes:
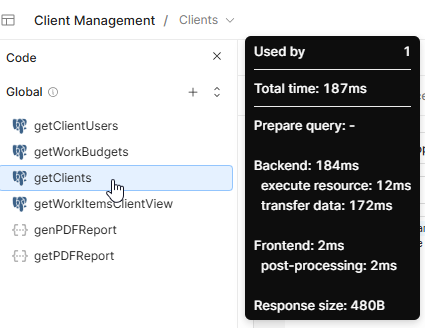
This is almost certainly responsible for a sizable chunk of the latency that you're seeing, @ferret141. Because all resource requests are processed by our backend servers, I typically tell folks to expect an additional overhead of ~500ms relative to hitting the resource directly. For whatever reason, the latency can be even worse on UK infrastructure.
If you have a particular query that is performing slowly, I can look at our logs and give you a more detailed breakdown of how that time is being spent!
Hopefully the above is helpful or at least informative, @ferret141! I'll reiterate my offer to look at our backend logs if you have specific queries that are running slowly.