I have self hosted environment and my apps were working nice and fast, no issues. Then yesterday out of nowhere any transaction is taking seconds to complete. These are very simple transactions too with specific select operations that don't pull back much data. This also happened while working on the localhost directly so it wasn't even a matter of network issues.
I followed some recommendations in the docs regarding pagination plus I have my apps separated to limit transactions and load. Does anyone have any other recommendations for performance tuning self-hosted? I am not sure where to start because up until yesterday I had no issues.
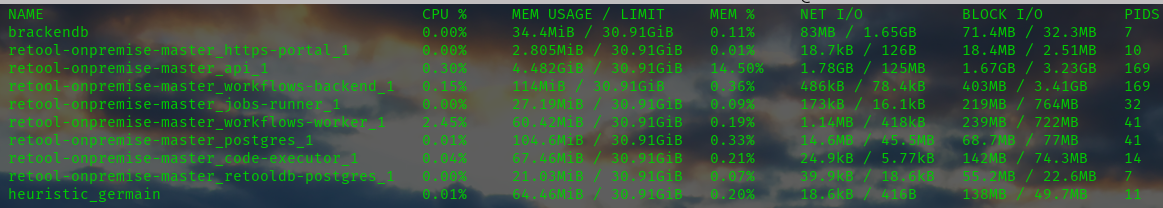
Here go some stats while just clicking on history button from one of the apps. Any transaction on the interface started taking seconds to complete where previously it was fast. I had no recent updates or changes to the system.
I compared my dev environment from prod and honestly my prod has much newer hardware and greater specs. On my dev environment I do not experience the lagging so am I not sure what to address. At first I was thinking revisiting sql statements but I am not getting any performance issues on dev.
I did notice that while having the stats up and loading one of the apps my CPU spiked way up on the API but then goes back down. For any activity within retool, even while working within the admin edit interface transaction are slow. Such as clicking to load history or anything. Any recommendations are welcomed.
Thanks for the follow up and information. I am not seeing anything useful in the debug regarding query performance. I may redesign my interface. Let me provide some screenshots with my logic. Perhaps the community may have a better approach.
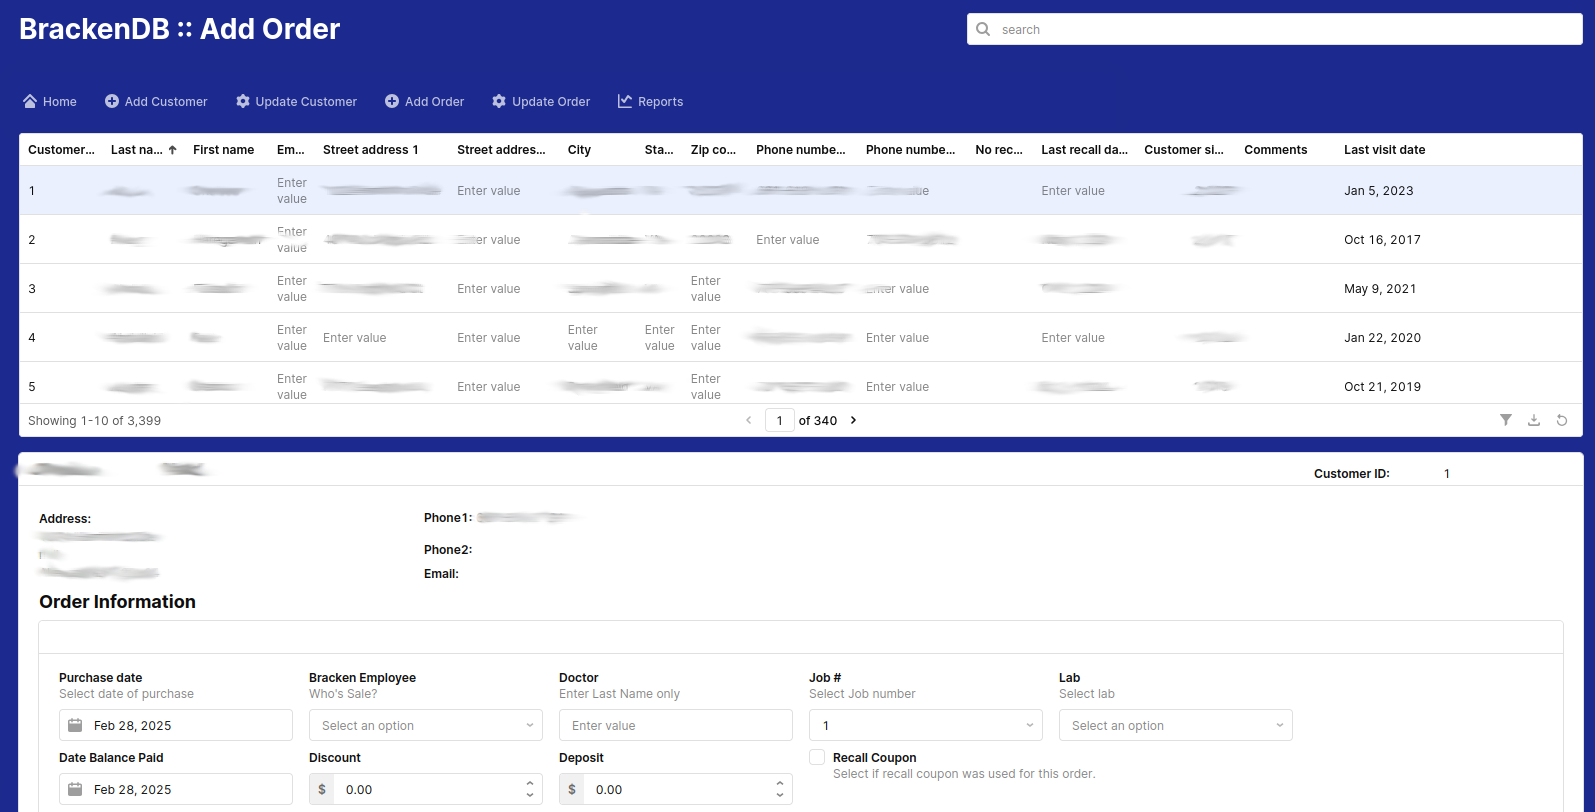
In the top part of the interface I have a table and a search box. This searches for customers. Then I would select the row that has the customer result I am looking for. Specific data from that record populates the container in the lower part of the screen.
The bottom part of the screen has fields that we would complete with order information for the customer. The orders table only has about 871 records. The top table (customers) has about 3300 records. You can tell in the first screenshot that the customers table has pagination.
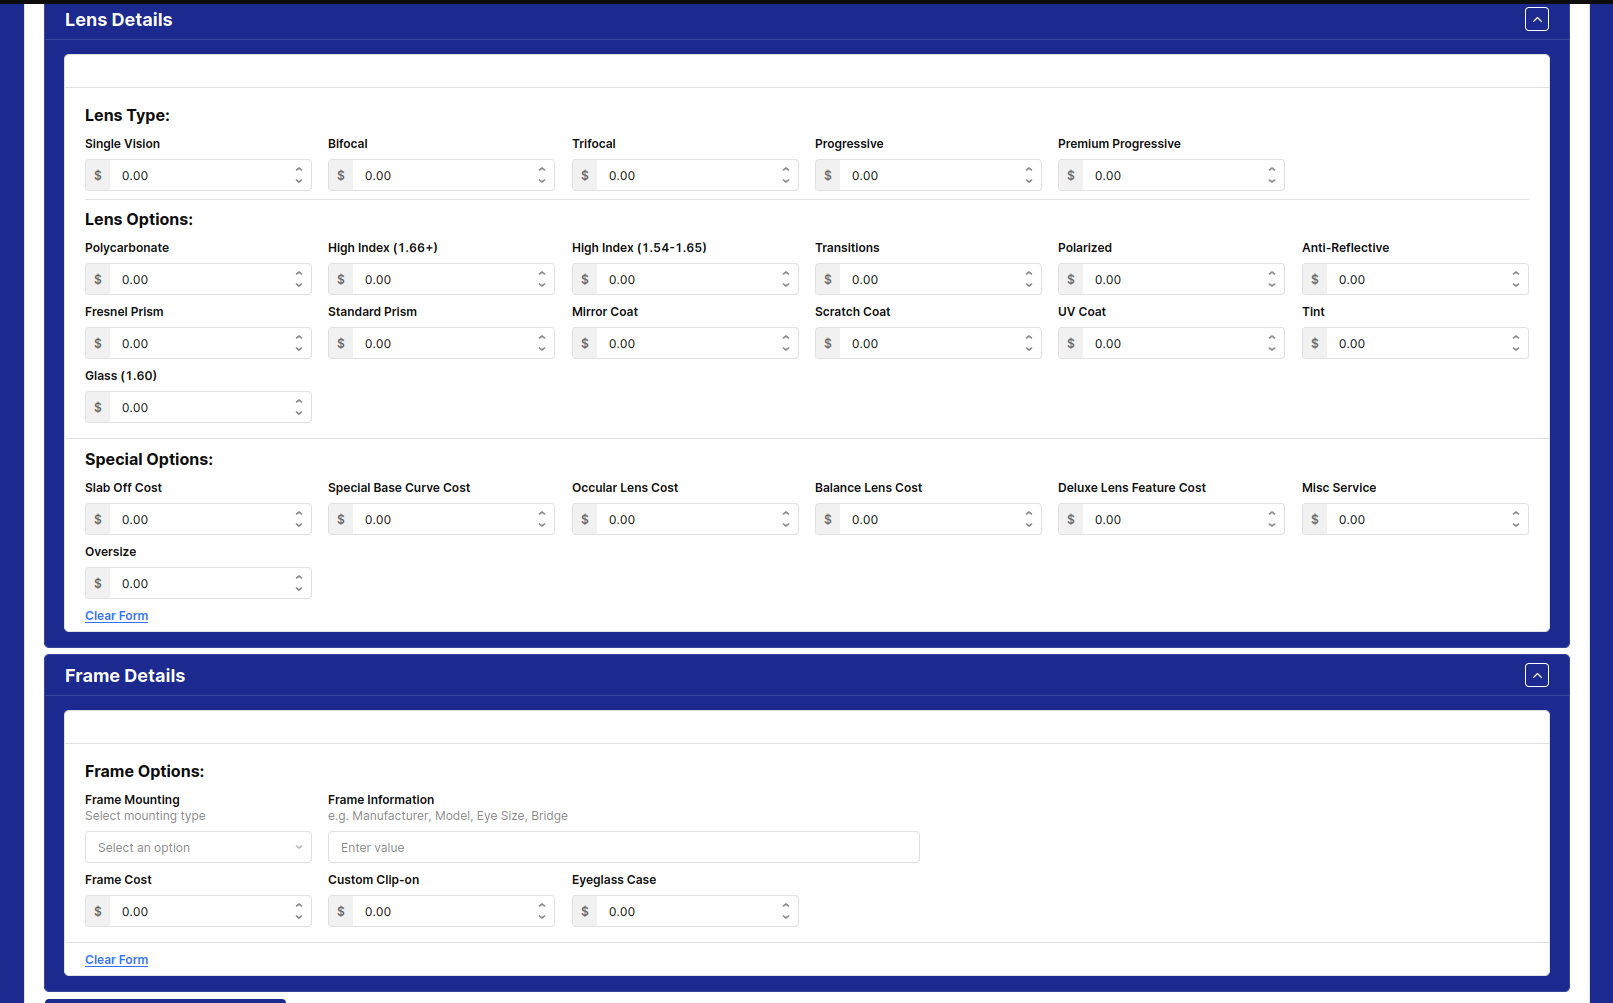
This screenshot below is the bottom section of the interface which is a container with 2 collapsible containers within it. There are fields within each of these sections.
Thank you for sharing the screen shots and explaining the app! This is super helpful for us as well as other users to chime in with advice on performance.
I have definitely seen similar apps
If the pagination is server-side on the customers table, that will definitely help a ton.
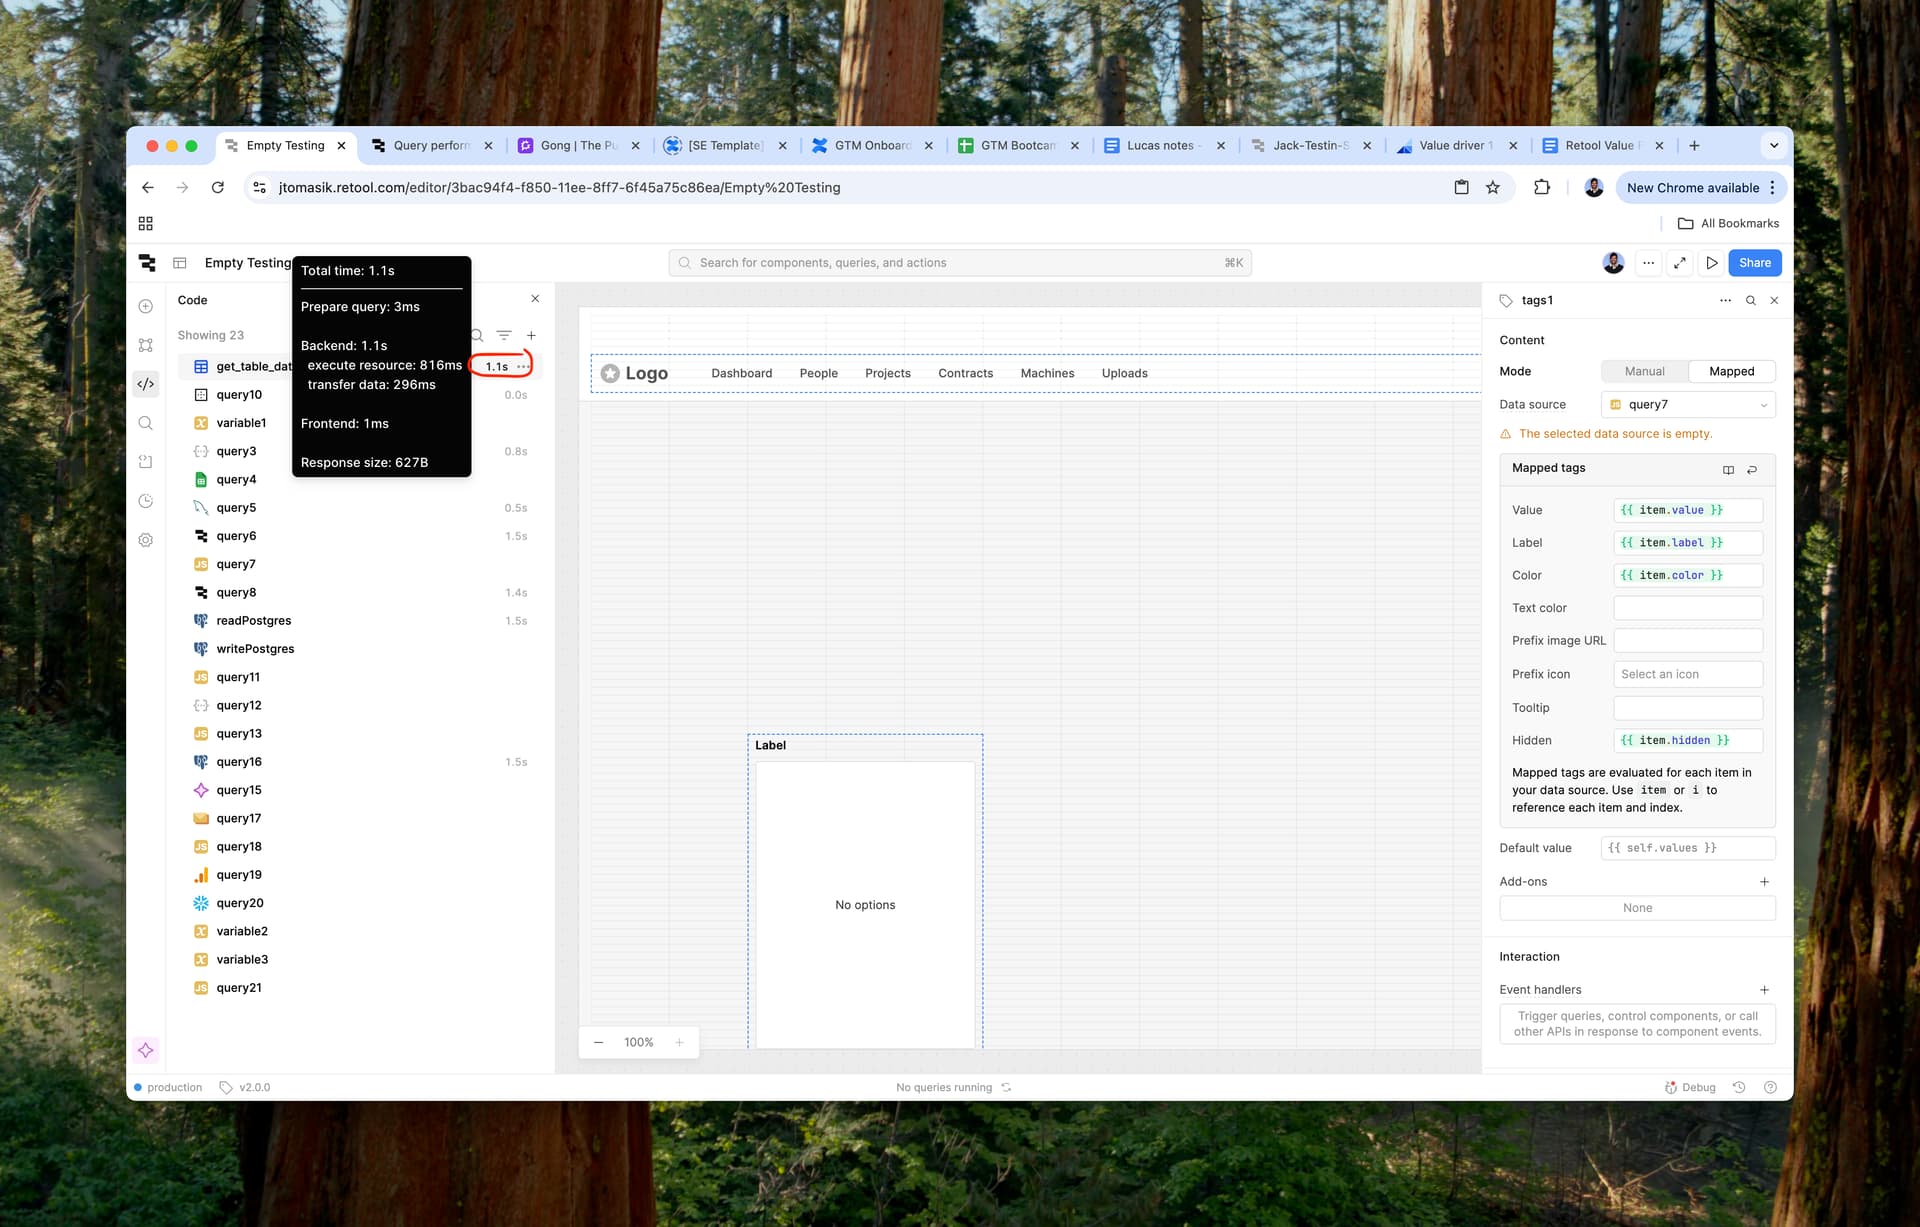
If you open up the query list, the run times are listed next to the query names. If you mouse over these numbers, there is additional breakdown of what part of the queries takes up how much time.
Let me know if looking at this there are any parts that take up a very large amount of time. Optimizing is all about only pulling the data needed for a specific event.
Server-side pagination will only load the data that is being displayed on the current page. This greatly reduces how many rows of data are being fetched per call.
Client side pagination is grabbing all the rows from every single page in one query, but only having the UI display the current page. With the rest of the data living in some type of temporary state in the app's browser window.