Significant delay on app load (before queries run)

hey retool community!

My app recently started experiencing very slow initial load. It looks to be a delay before actually running queries, etc. Loom here of loading deployed app, and Loom here of launching app via editor.

In the live deployed app video, you can see that there's 7-8 seconds where nothing is happening. You'll see a much longer wait on editor (which is somewhat expected), but there's 10+ seconds where the retool toolbar shows up on bottom left of the app but it shows no queries running.

Any ideas what's causing that significant delay before queries start running?

Is this an issue on my side with the app being too big? I understand I can improve performance by not running all queries on page load, delaying some queries on page load, and possibly breaking it up into multiple smaller apps.

But i'd love any support on knowing where to start debugging. I already checked network speed (~300mbs download). I recently started using a custom web font (Object Sans), and a light mode/dark mode, but wouldn't think those would be the issue.

Thanks!

Nate

3 Likes

Our team first started reporting this a few weeks ago. I witnessed their videos of it and live during screenshares, but for some reason I was never afflicted by it.

That is, until a few days ago. It's pretty much exactly as @thenatechambers describes in the excellent write-up above.

I haven't attempted to investigate too deeply, but the "Time to first query" Retool info prints in the console range from 10 seconds to 34 seconds:

Performance Log: Time to first query: 34303 ms

(I doubt the deprecation warning is related, especially as it occurs afterwards, but I included it anyway.)

We haven't changed anything significant about the apps exhibiting this, but they all tend to be somewhat larger in terms of code/components/queries. But, again, there used to be barely an discernible delay on a fresh load and when all the Retool UI + queries began loading.

If I had to guess, this is the result of runtime changes on Retool's end, e.g. the change in version folks will see in their diffs from time to time regardless of any changes by an editor:

2 Likes

quick follow-up with some technical details:

Chrome: Version 124.0.6367.60 (Official Build) (arm64)
OS: macOS 13.3.1 (22E261)
Retool v3.47.0-83f1c71 (Build 168484)

Not sure if it's a coincidence, but every time I asked a teammate experiencing this issue to try on Safari, the initial load was very quick by comparison. Same for me trying just now: an expected 3–5s loading a large app in a fresh tab.

thanks for adding your context here @dguzzo!

I just tried loading my app on Safari browser and didn't experience the issue. It does seem to be isolated to Chrome.

Looking forward to any insight from the Retool team.

1 Like

We have been facing similar issue in our app where the screen says blank for 5-10 secs after the initial load. This issue has been happening for the past 15-20 days or so. Before that, this app used to load fine. Like @dguzzo mentioned here, I have tried in safari also, but still the same issue. I am attaching the screenshot of both safari and chrome's console for reference. Quick help here will be appreciated here.

1 Like

Hey everyone! We've raised the load time issues with some engineers on the team who focus on performance. We have seen load times overall get worse in the past few months, and there is a code fix being released in our Cloud deployment tomorrow that should address this. Would love to continue to hear everyone's feedback when that goes live so that we can continue to improve.

In the interim, it is accurate that Safari tends to be faster as it executes the runtime more efficiently, so using Safari should offer some relief.

I'll ping here when we deploy tomorrow as well so that you have a time frame of reference to test again. Thanks!

2 Likes

@joeBumbaca thanks so much for the update! Exciting to hear a fix is being deployed tomorrow. I'll make sure to share feedback.

2 Likes

Hey all, this runtime improvement has been live for about an hour now. Would love to hear if you have noticed any improvements in the app load time / time to first query run. Thanks!

1 Like

hey @joeBumbaca, thanks for the follow-up. I'm seeing slightly improved time to productivity (from ~3sec to ~2sec), but the time to first query is still almost 10sec. See screenshot attached.

Interested to hear from @dguzzo and @mathan-xflowpay if they've seen improved time to first query or if it's the same.

1 Like

Hey @thenatechambers, thanks for the follow up. I'll pass this along to the team.

As an update as well, we rolled this change back this morning due to some other issues. I'll ping here when this is live again.

1 Like

Also experiencing this for the past 15–20ish days. Came here to see if others were affected. Turns out they are.

I'm on 5gb up/down stable fiber connection. Coworkers, located elsewhere, have other fast connections. All of us experience the problem.
This also seems to be app agnostic. Some apps we haven't touched in months started to experience the issue. It also affects apps that don't have any queries or scripts.

  1. Click to open up an app.
  2. Page & retool starts to load, then there's basically ~5–10 seconds of nothing happening. This is quite frustrating to all of our users.

I'd love a fix for this asap.

1 Like

Same thing here. 10-20s of inactivity before queries start firing. Was not an issue in the past. Experiencing this on Chrome, Arc, Safari, and Firefox.

Screenshot 2024-04-29 at 1.45.29 PM

Edit: I've noticed this doesn't happen if I open the app's by navigating to its URL directly. It only happens when using the Table component's "Action" to open the affected Retool page. I've also noticed that whenever it happens, there is a large spike in CPU load.

Hey all, lots going on in this thread, and not all necessarily related.

  1. There was some code released Friday afternoon that should alleviate some of the issues above.

  2. We have also discovered really obscure bug when loading apps without their uuid included the URL . @KennyK, not sure what action you are using with your table but this sounds like that behavior. We are actively working on a fix for this.

  3. App size, etc still has large impact on performance. @thenatechambers Your app likely falls into this category. Lots of plugins, and the older (less performant) listview v1. Can you share what the performance tab of the debug console looks like? A refactor to a couple of smaller apps and updating to the new listvew v2 will likely have the most impact for you.

1 Like

Thanks Joe!

Thanks so much @joeBumbaca! New time to first query is 2875ms (so 3-4x faster than before). Tell the eng team thank you!

Regarding my app specifically, a few follow-up comments/questions:

  1. listview v1: Noted, will work on updating this to listview v2
  2. Refactor to smaller apps: Are there any forum threads or documentation you can point me to on how to get started with moving to multiple smaller apps? Big question is...do I duplicate current app and strip out majority of functionality to get to a smaller app, or start fresh and build up to a new smaller app?
  3. I'm getting two messages in the debug console that i'd love some support on:
    3a. "Unexpected: startMetricTimer was called again probably due to runtime reinitalization"
    3b. "error in computeTemplateStringDependencies..."
  4. Performance tab of debug console screenshot attached. I'm working on reducing number of queries run on page load, and definitely want to start breaking this into smaller apps, but calling out that the update y'all did on Friday was super helpful as noted above (3-4x faster to first query)

I think this may be my issue as well. Is there another thread on the forum to track this more specifically? We use the custom URL page settings for our core apps.

Hi everyone,

Our users are experiencing similar performance issues the last few weeks. Thank you all for sharing details here and for the updates @joeBumbaca.

I know there may be several different issues overlapping here so I'll try to provide as much detail as possible in case something is useful for the Retool team or anyone else debugging their apps.

My general issue
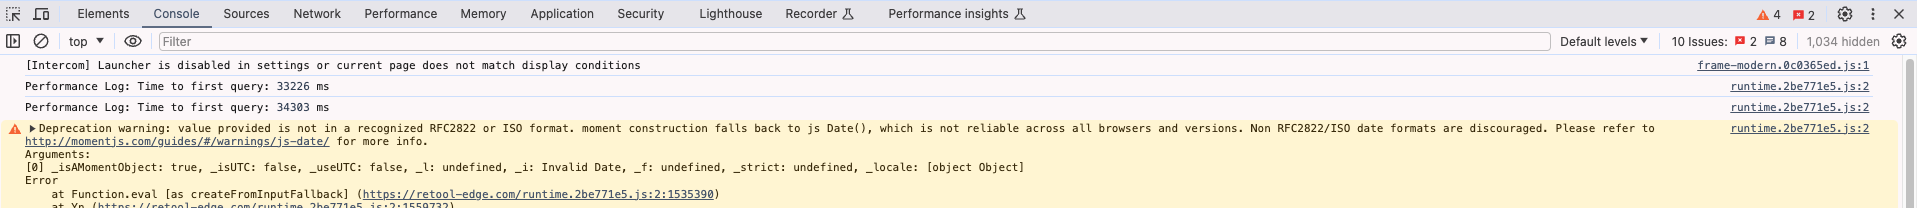
Users are reporting 2-3 seconds to load apps in Safari vs 10-15 seconds in Chrome. These are anecdotal from non-technical users so I don't have exact data from dev tools for Performance Log: Time to first query: x, time to first contentful paint, or similar. I got a video showing the difference between Chrome and Safari side by side which matched these estimates visually.

Details from our users:

  • Devices and OS: A mix of windows and mac.
  • Browser: only seeing this on Chrome
  • Internet: 2GB fiber
  • Location: Central US (Oklahoma)

Like @dguzzo and @thenatechambers, our issue seems to be isolated to Chrome.

Some details on our multi-page application:

  • App 1
    • ~30 components, basically just a table and some supporting filter/search components
    • The table has <150 rows of data in production
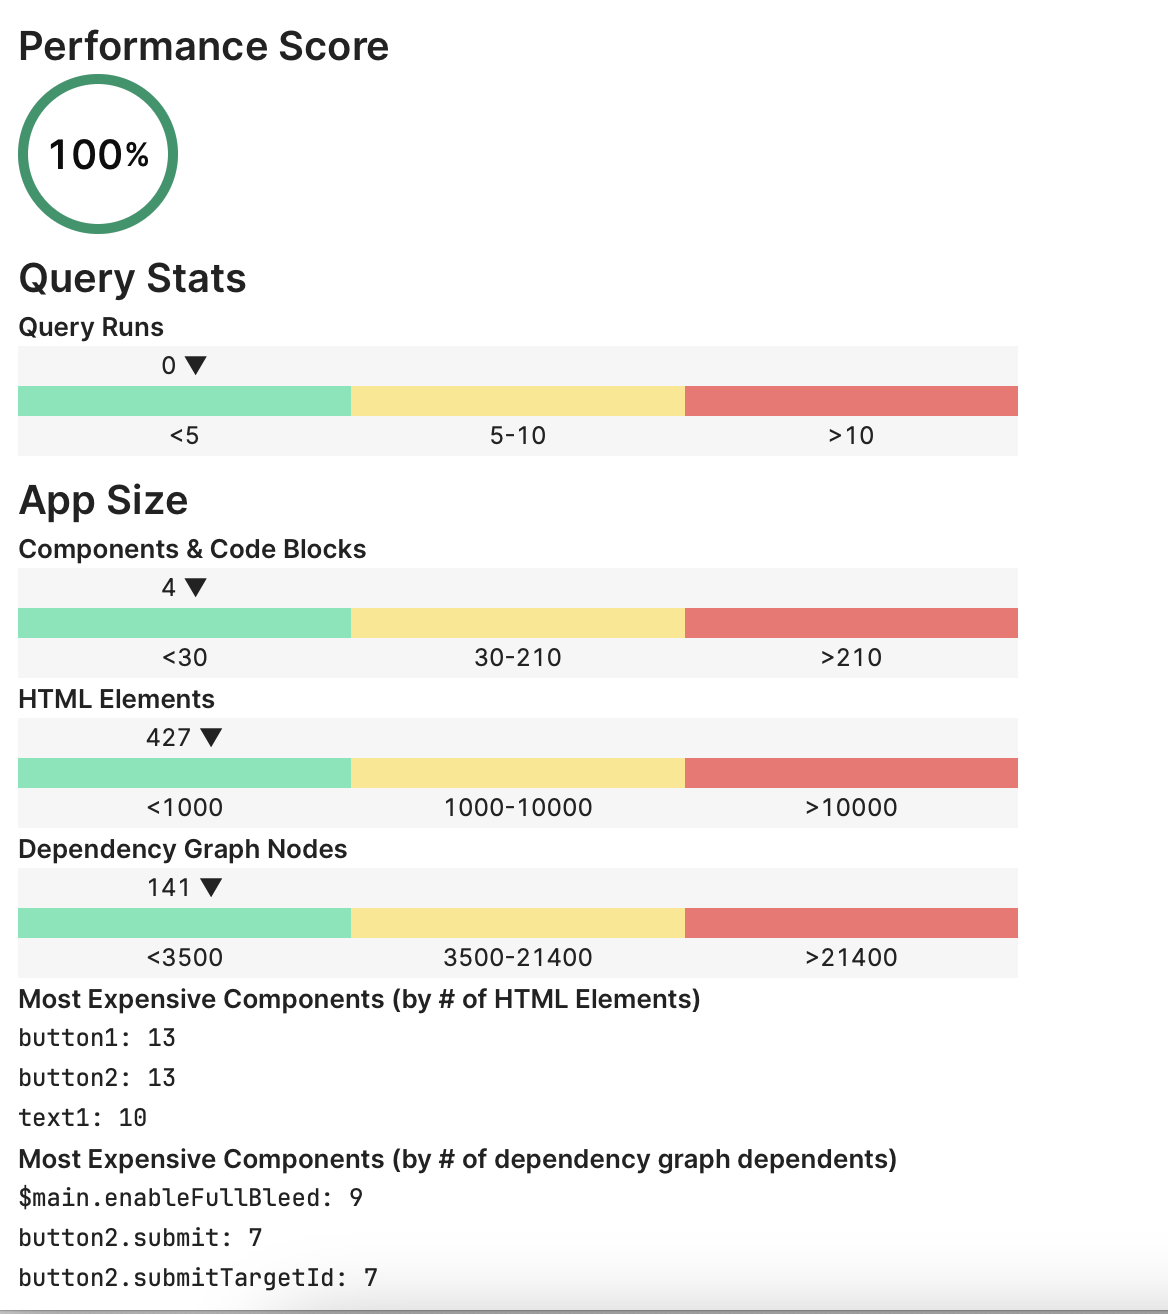
    • 100% performance score (2 query runs, <30 components and code blocks)
  • App 2
    • Identical to app 3 but loads different data in the table (<50 rows of data in production)
  • App 3
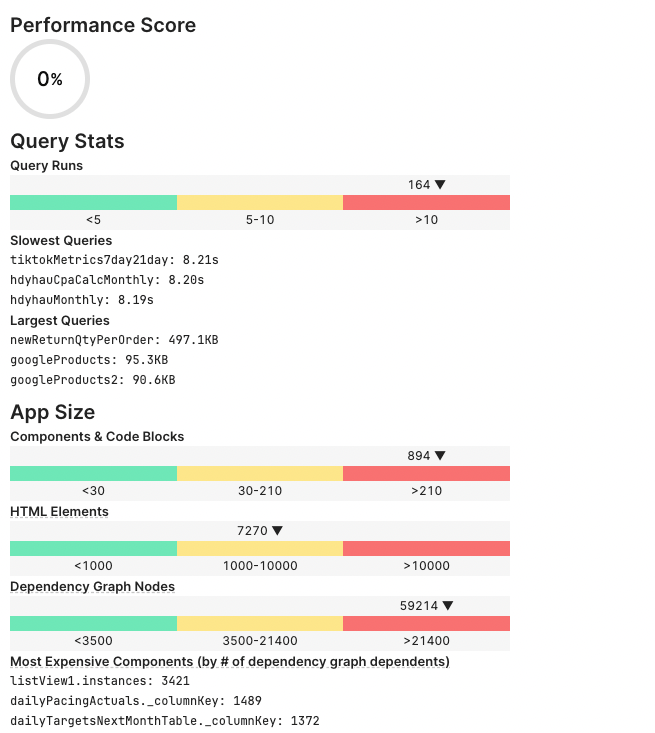
    • A much more complex app with 32% performance score
      • 4 queries on load (many more on actions in app)
      • >500 components and code blocks
      • 26840 dependency graph nodes
  • A header module shared across all three apps
    • Logo + navigation buttons
  • Retool Cloud V3.50.0-a6ac5e6 (Build 1702460

Navigating between Apps 1 and 2 is understandably faster than between 1 > 3 or 2 > 3. But I'm still seeing consistently ~3-4 seconds to load (Performance Log: Time to first query) Apps 1 and 2 whether I navigate in-app or go directly to an app's URL.

My personal experience has been much faster than our users despite worse internet connection and a slower machine.

My specs:

  • Chrome Version 124.0.6367.91 (Official Build) (arm64)
  • macOS 14.4.1 (23E224) (Macbook AIr M1 from 2020)
  • Location: Vietnam
  • Internet: varies, but usually 50-100mbps down

Nothing seems to have improved in our case. Users are reporting this for a few weeks and the newest report + video is from yesterday, Wednesday May 1. I don't have good before and after metrics to share beyond the anecdotal and what I tested today.

I thought this might be happening in our case as well but after checking I don't think it is. The main navigation in our app (besides links in a header module) is clicking a table row. Click row, navigate to view that row's data in more depth in App 3 (the most complex). I double checked and this table action does load the target app with the uiid in the URL in format https://<subdomain>.retool.com/apps/<uuid>/<app_name>?<query_params>

I've been watching the performance score drop as we add more functionality and considered splitting it up. But we've also been experiencing this issue of app blinking and modules reloading causing poor multi-app experience so I am hesitant to split the bigger App 3 out into multiple apps for performance until I can ensure the multi-app experience is smoother. The load delay + blink really feels like navigating between two different web pages instead of two parts of the same "app". And though the performance score is low, I haven't personally had issues with this bigger app loading as slow as reported.

Edit, my tests below are no longer relevant:
I thought this showed that a simple Retool app was loading much slower on Chrome. But I realized having Chrome devtools open was slowing my requests. I'd checked that the cache was enabled and there was no network throttling so I thought there was no difference. Disabling async stack trace as suggested in this Stack Overflow thread now shows my Chrome load times are similar to Safari and Firefox. I am so far unable to replicate the slow load times reported by my users.

Some new tests
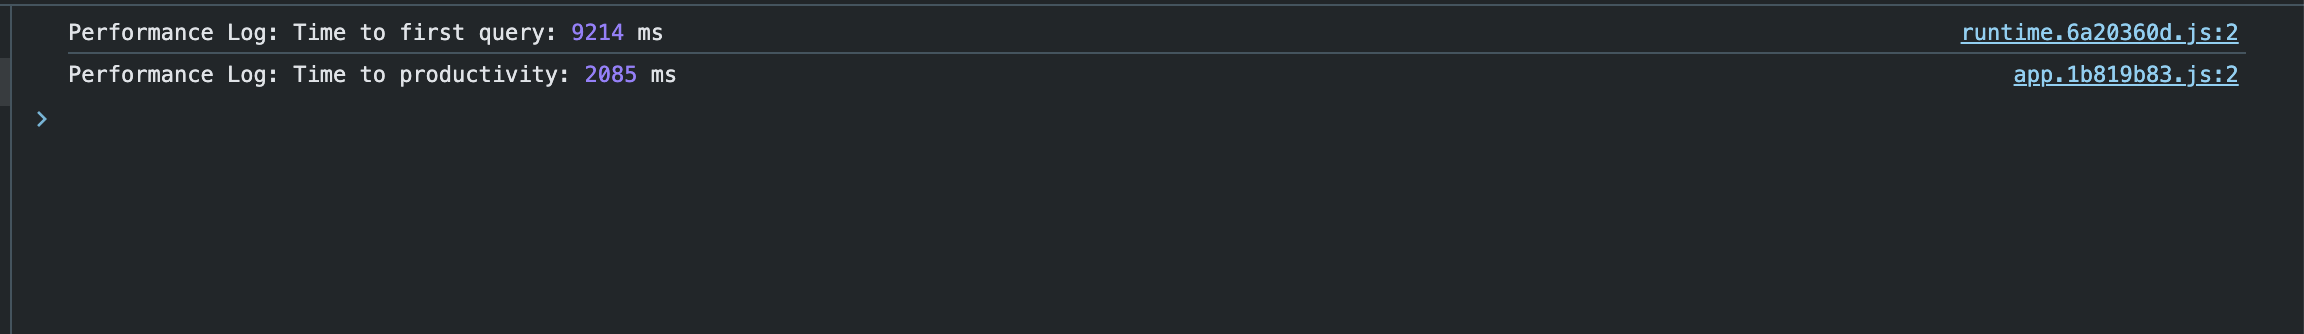
While testing this issue today I noticed the slowness of loading/navigating between our two smaller apps 1 & 2 (with 100% performance score). It's not 10-15 seconds like users are reporting, but it's slower than I'd expect given the simplicity, performance score, and my internet/machine. Seeing Performance Log: Time to first query: of ~3000ms consistently.

So I devised a little test. I created 3 brand new apps:

  • Apps contain <5 components each (couple buttons and text header)
  • One app includes a table with some dummy data and event handler for row clicks to navigate to another app (similar to our real app)
  • No queries in any app
  • All have 100% performance score:

Here are the apps:

These apps are dead simple, just navigating between each other with the buttons and the table row action. I then compared navigating between the apps across Chrome, Safari, and Firefox using Performance Log: Time to first query in the console for simplicity. I disabled all extensions on all three browsers and only had 2 tabs open on each.

Video: Here is a loom video showing the same app on each browser.

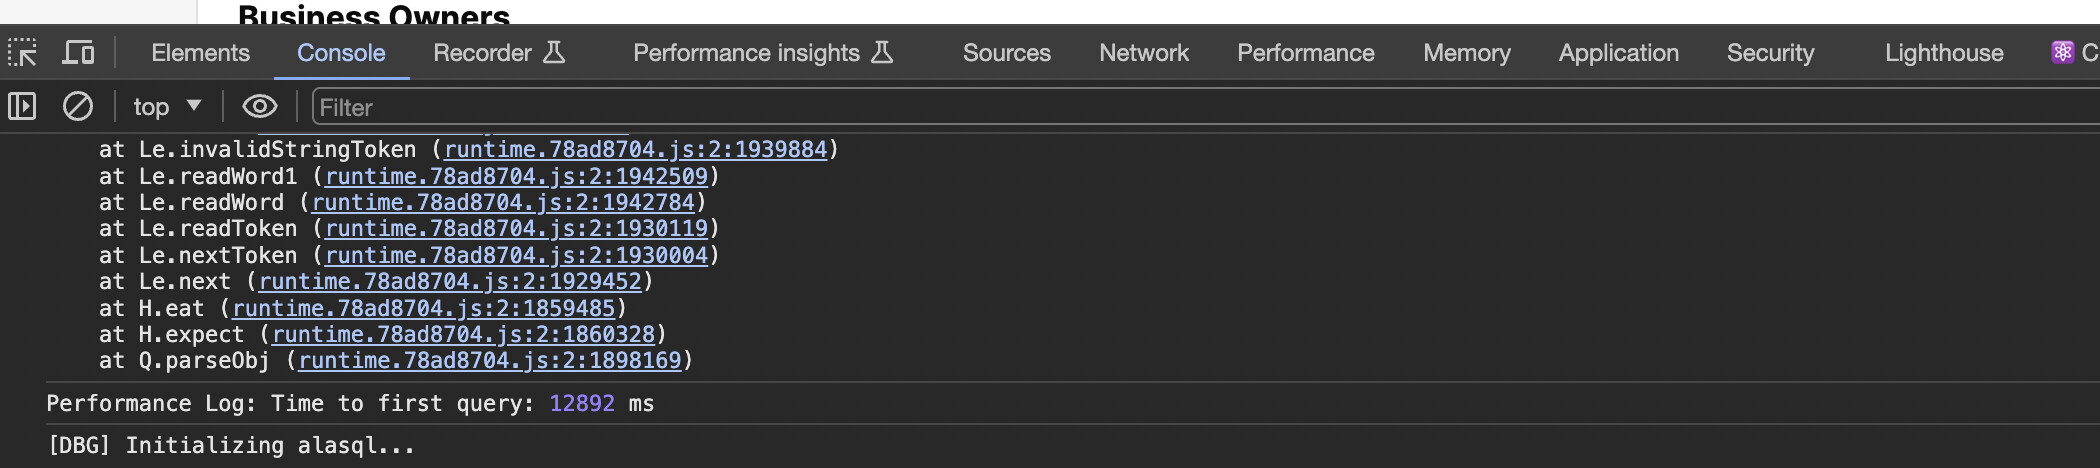
The result: I consistently got ~2500-3500ms on Chrome and ~600-800ms on Firefox and Safari.

Comments on the issue I linked above related to app blinking mention modules as a potential cause so I did two other tests:

  • Copied all three of my brand new test apps and added a header module to all three with navigation to all three
  • Copied our actual three apps and removed the header module from all three

In both cases the performance is similar with and without the header.

Hope this helps in the debugging process and performance issues we can't impact with in-app tweaks will be resolved soon. I'm working to get more concrete details from our app users and do some additional testing with their machines and if I learn anything useful I'll update here.

Anecdotally, I've noticed that the performance of my retool app is VERY bad on Windows computers using Chrome compared to OSX (using ANY browser). My app is complex; over 100 objects and queries and VERY large tables.

I've always developed on a Macbook (First an M1 and then an M3).
On the macbook, I can load tables with record sizes up to 100k and nearly 50 columns with basically no problems. This simply isn't even possible on Windows machines. Even my Llama3 box (dual 3080s, i9) can't hold a candle to even my M1's performance in the browser.

I have no idea why this happens but I have some end users with fairly average windows computers that (to me) looks like a borderline unusable experience.

I'd be happy to collect evidence but I'm not even sure where to start.

Upgrading all our tables to the new Table component has resolved this issue for us!

FYI @joeBumbaca

I forgot to include that we are only using new table and list components, no legacy components used.