I'm getting close if I can make two tables scroll in sync with each other. Does anyone happen to know if this is possible? Or, if anyone know of a better to recreate this, I'm all ears.
This really depends on your design and what you are trying to accomplish. Off hand, I don't know of way to make two tables scroll together and so maybe explaining your goals might help the forum help you!
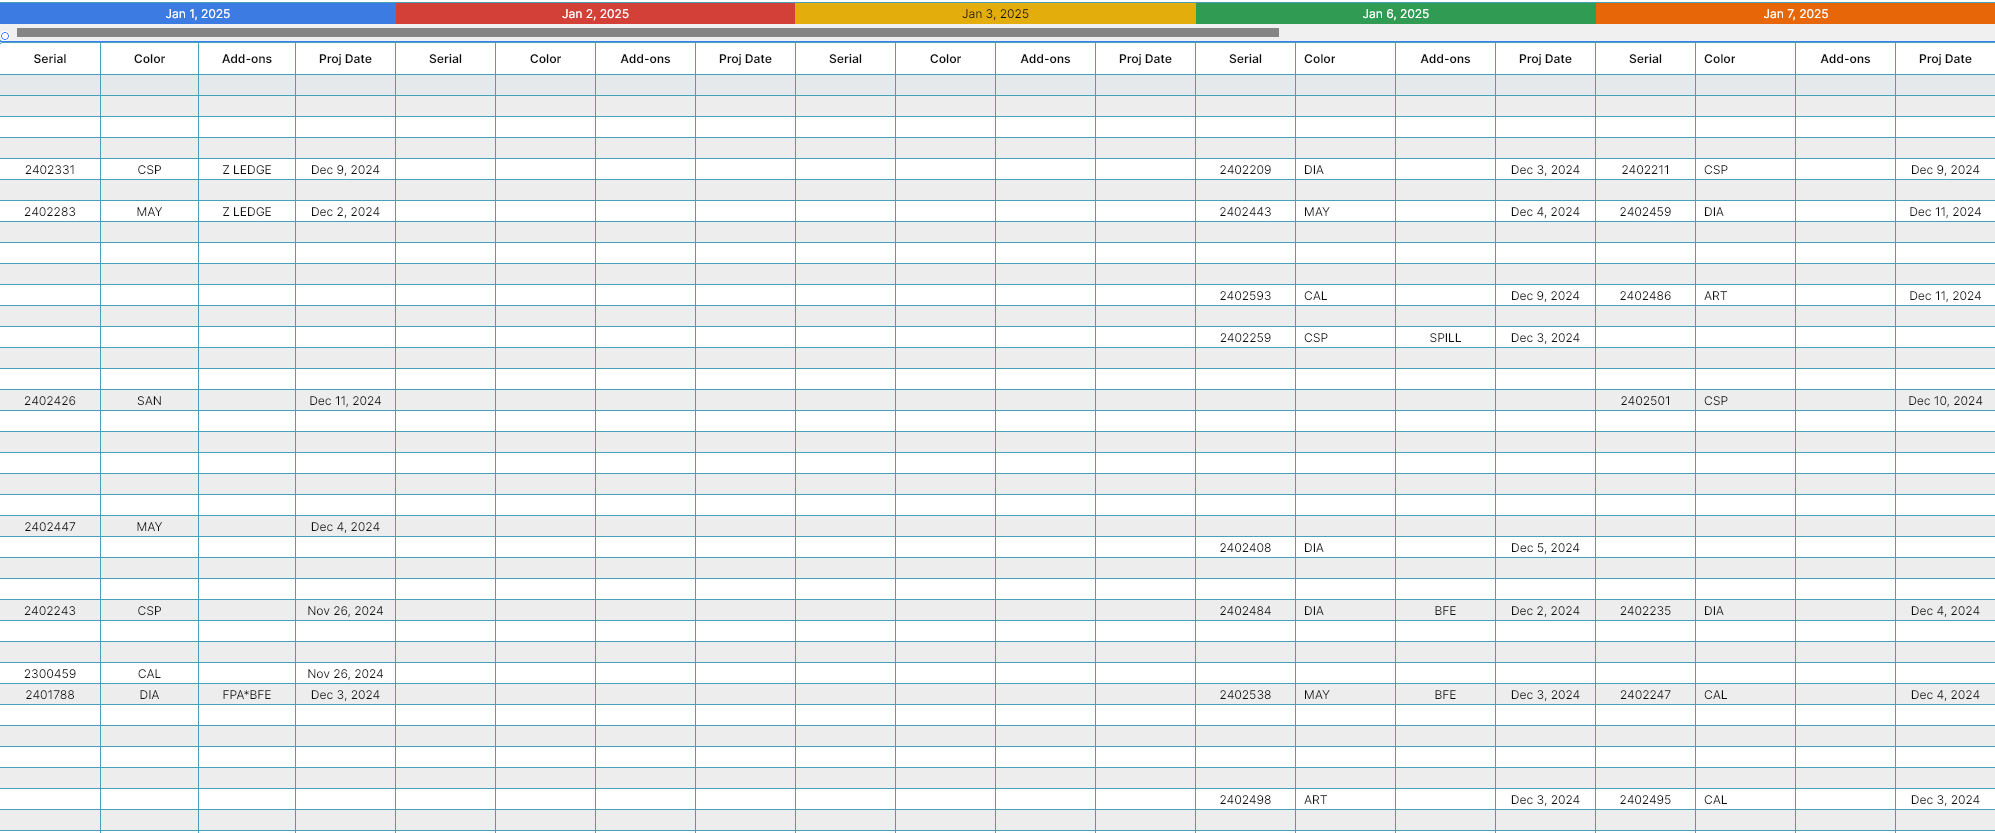
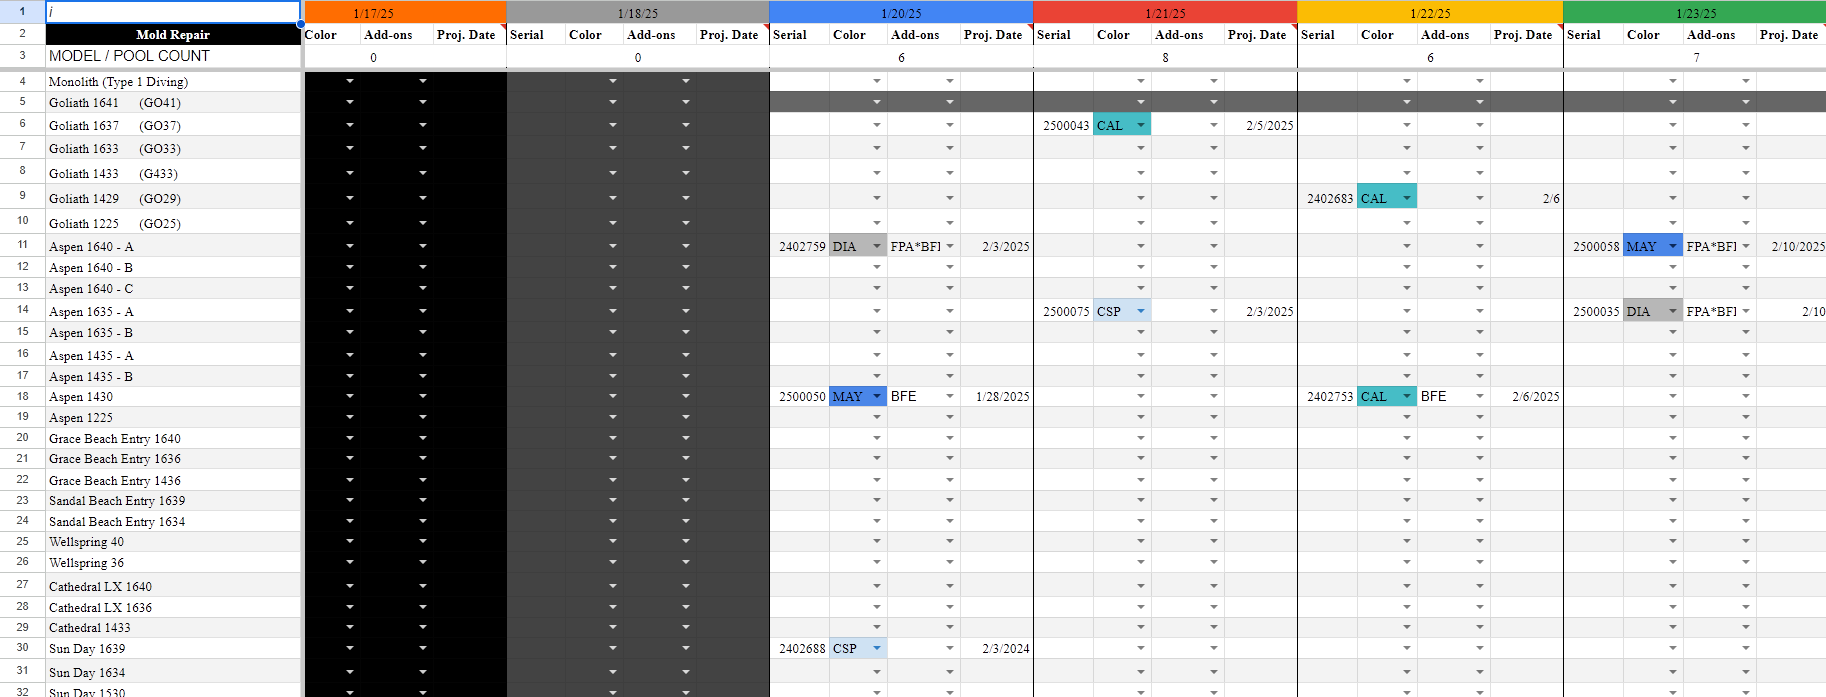
As you can see from the image I uploaded, the date row at the top has cells that stretch across four columns, then you have the four columns which are Serial, Color, Add-ons and Proj Date. then there is another column that contains the number of products built for the day and it also stretches across four columns.
To accommodate this, I was thinking of having one table at the top that had the dates, then a separate table underneath that with the data that contained the four columns of Serial, Color, Add-Ons and Proj Date. Both tables would stretch for quite a distance horizontally. The problem is that they won't scroll together so when you scroll one table, it is no longer in sync with the other table.
I thought using stack containers might do the trick, but apparently, they will not scroll indefinitely horizontally.
@tomm
Yes, I did. But I guess what I am asking is what is the goal? Is the table actionable or just a view?
If it's just a view, you may want to consider a different type of design.
You could have one table component and then allow the user to filter by date and that way not have to scroll horizontally. Could also have table load with default current week or month etc. This is something I have done in the past.
I actually attempted that first and showed it to the boss and she wanted nothing to do with it. It's a production schedule for building fiberglass swimming pools and sometimes we have a mold that needs fixed, and so it can't be used for a while and she just loves being able to scroll horizontally and see are molds are marked as such, etc. It's sort of difficult to explain. They have been using spreadsheets for a long time here and it's been very hard to get them to even discuss changing, but I'm making some headway.
Would you or @AbbeyHernandez know of anyone that could assist in the construction of a custom component. This is the one piece of the puzzle that I have not been able to duplicate the spreadsheet in some fashion, and it would be really nice to have the all the data in one database instead of spread over numerous spreadsheet that all need updated when there is new information to add.
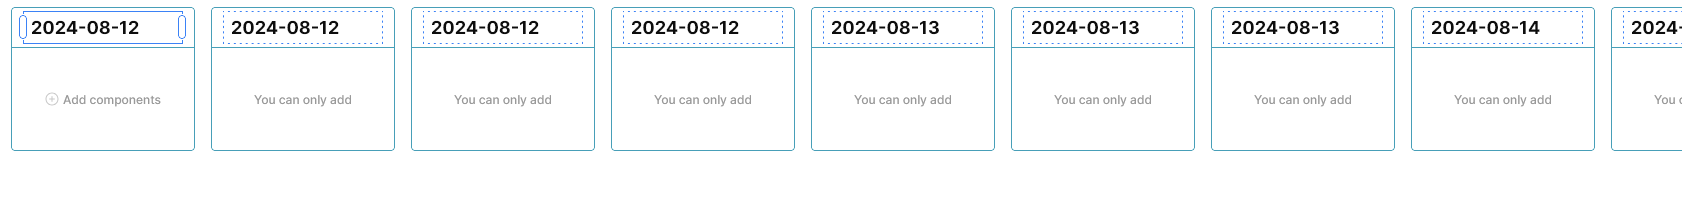
I was thinking that a horizontal scrolling grid list might work, not really sure of the use case though.
Then each repeater is a table of data for that day. Again, not really clear to me what structure this data is in.
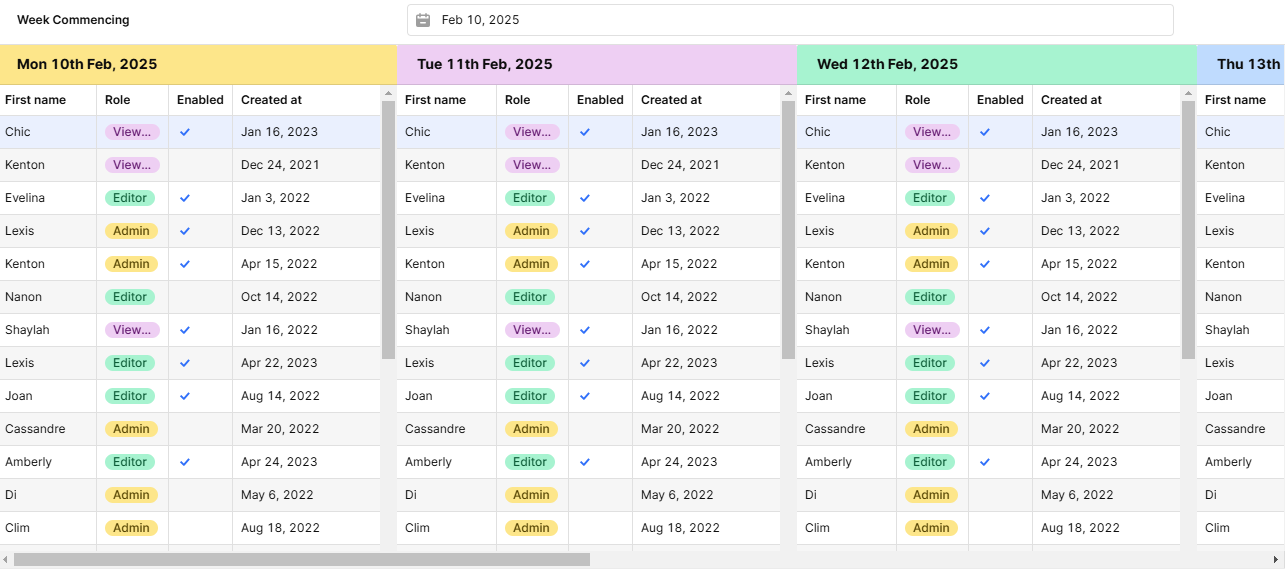
Something like this maybe?
@dcartlidge, this looks very promising, but I am having some difficulty getting it set up. I'm not sure if I have the data in my database set up the best way to utilize this component. What you have displayed in your screenshot is very close to what I need.
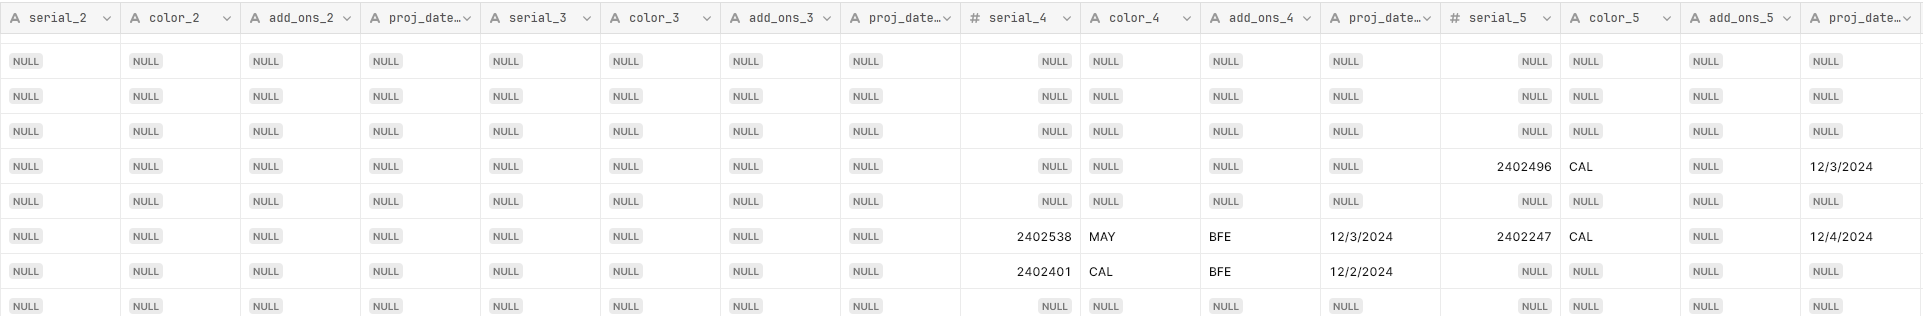
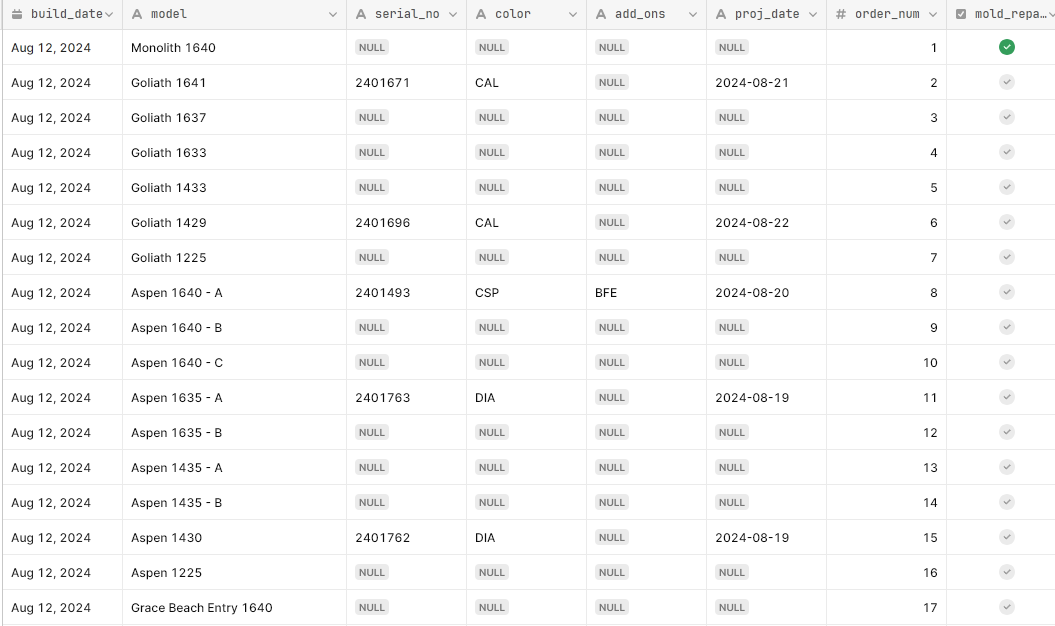
My database schema is shown in the following screenshot:
Not to worry - all data can be transformed to fit the component if needed.
Not entirely clear to me what each row represents so I can't necessarily make many insightful suggestions but... it would look like your query to get the data needs to group by the date - or perhaps you could do that in a transformer (but it would probably be more efficient to do that in the data layer)
Essentially, I'm thinking that each "record" you want to display needs to be the set of rows for a unique build_date but at the moment it seems like you have a "record" for each row. Is that roughly correct?
Basically, the list of pools always stays visibile on the left hand side. When one of those pools is put on the schedule to be built, the serial number, color, add-ons and proj date are entered under the appropriate day heading. For any pools that are not scheduled to be built that day, everything remains blank.
Ahh, I think I understand now. That's quite an unusual view (to me) - it's a list of all the products and then the columns are grouped days of orders for each product?
I think I'd assumed that you'd want to view orders by date and within that the product - my initial mock up probably wouldn't have given you what you want, in that case. That would have been orders by day, not products by day.
I think the data structure might be working against you in this case, you're attempting to replicate Excel but the data feels relational and you may want to consider splitting products and orders into 2 data sources/tables.
I'll see if I can come up with something to show you what I mean.
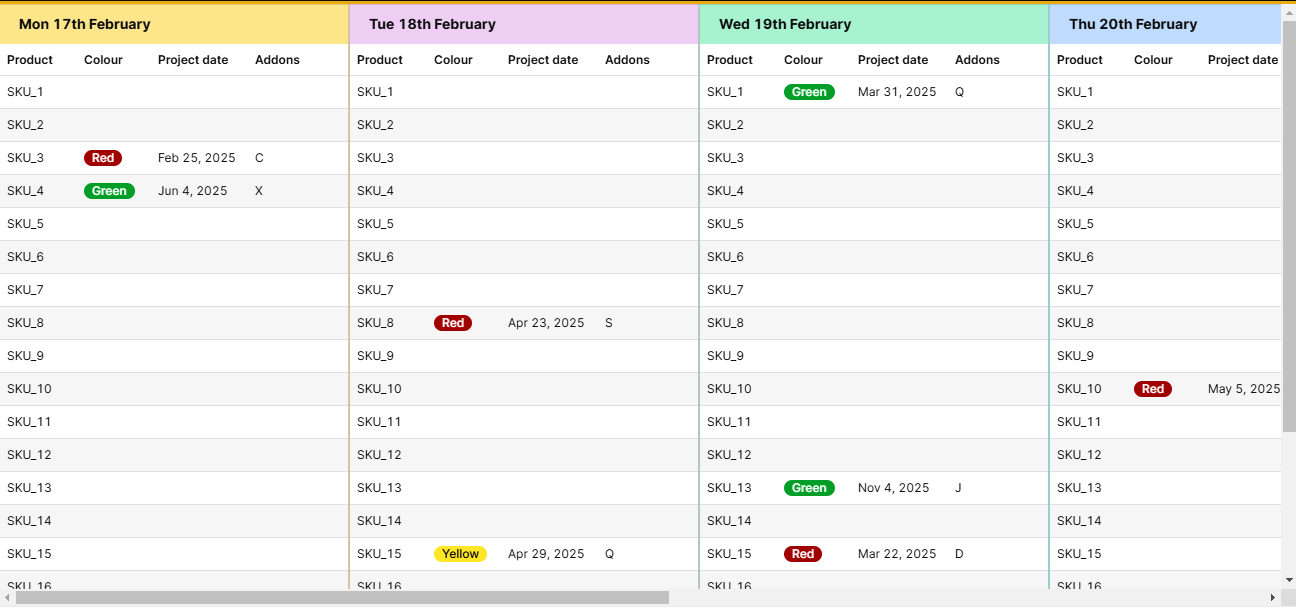
Here's the demo. I used some fake data from the wonderful Retool API Generator
This might get you going but you will still need to transform your data structure a little. There are comments in the code that try to self-document what it all does. forum (3).json (19.4 KB)
@dcartlidge, this is so close to what I am looking for. Thank you for spending time on it.
My main remaining questions at this point is, do I connect to my actual data through the API like you did? Is there a way for me to see the data that you created so I can compare it to my working data?