Introducing the new Timeline component

Hi All — excited to announce our new Timeline component, live in beta on Retool versions 3.70 and above. Timelines are the best way to display chronological events, with a layout similar to Gantt charts.

Tips

  • Configure your timescale unit (years, quarters, months, and weeks) in the Appearance section
  • Group your Timeline events by configuring "Grouping" from the Add-ons section and passing properties to group on in the Properties input
  • Switch between an densely packed timeline or a single event on each row by toggling "Render one event per row"

What's next?

  • Adding support for displaying milestones for events without a start date
  • Better tooltip customization
  • Additional APIs like scrollToDate()

The official docs are here.

Please share any feedback or additional request you have, we're excited to see what you'll build.

Note: Retool's old Timeline component is still available but has been renamed to "Event list". Event lists are simpler, vertical presentations of chronological events. We'll also be refreshing the Event list component over the coming months.

20 Likes

@nicos thank you! This looks great, and it'll be much easier than building a Gantt chart with a custom component.

1 Like

@nicos This is awesome. We're looking at using this to display info from a booking/scheduling system, as a sort of horizontal calendar. Are there any plans to make the timescale even more granular? We have hourly bookings and a daily view would be helpful, or a user-adjustable timescale.

2 Likes

@davidhamilton Glad to hear you're considering the Timeline component for your booking system! Making the timescale more flexible is definitely on our roadmap.

In the meantime, I might recommend using the Calendar component for those hour-by-hour use cases. Would that possibly work for your use case?

Is this based on a third party library or is this an in-house creation?

@kschirrmacher this was built from scratch by our team.

1 Like

Used this today and came across a number of bugs. The default "today" doesn't always work, for example, I have the following (so it displays the current 12 months as of today's date - 6 months previous and next 6 months) - {{ moment().subtract(6, 'months').format("YYYY-MM-DD") }} yet, it begins at the start of 2023. Also, I have the following javascript to try and change the quarter set up, but it seems to have no effect:

timeline2.quarterStartMonth = 4;
timeline2.quarterStartDay = 1;

Is this feature still in beta? It looks very good, but evidently still has a number of issues.

This is what happens when you view it - given the set up above. As you can see, it should work, but doesn't.

@FloodMatt Thanks for the feedback and for giving the Timeline feature a spin!

About the “today” date issue: it definitely sounds off that your timeline starts at the beginning of 2023 with the date range you’re using. If you could send me a JSON export of your app, I’d be happy to take a closer look and see what’s going on.

As for changing the quarter setup, in Retool, you can’t set values directly in JavaScript that way. We would need to have an API exposed for those kinds of updates, and unfortunately, that isn’t available right now for the Timeline component. But we’re always working on adding more features and making things better - I’ll work with the team to get this on the roadmap.

@FloodMatt as another quick note, you can set the custom quarter start month & date via the "advanced" settings in the Appearance section of the editor (screenshot attached). There's no way to set it programmatically, but interested to hear from you if setting it programmatically would be useful.

1 Like

The new timeline component shows promise, but there are still some issues that need to be addressed:

  • The "Expand groups by default" option only expands the first group. If there are multiple groups, the rest need to be expanded manually.

  • There is a lack of timescale customization. For example, when 'Week' is selected, it's difficult to determine the year or month being displayed. Additionally, the day labels (T, W, T, F, etc.) should allow for more customization, i.e., full name VS short name VS any other option really. Another example: when Month is selected, it is impossible to determine whether a given day of the month is a Tuesday or a Saturday without looking at an actual calendar.

  • Related to the point above and as a workaround, I attempted to include month and year information using meta events. However, when grouping is enabled, the meta event labels disappear behind the group column (see attached screenshot).

  • Related to the point above and as a workaround, I then created a "daily" meta-events list displaying the month and year for each day. However, the display of these daily meta-events is buggy, as they appear to overlap even though they shouldn't (see attached screenshot).

  • Another issue is that when events are present, the line of the group column disappears at the first group row (see attached screenshot).

  • There is no option to customize or turn off the color or transparency of event borders or shading. For example, I'm trying to match event colors to the background color (white on white) to indicate that these events are less relevant. However, a gray border or shade still appears, and it cannot be turned off or customized.

  • There's no way to add "groups" without events. For example, in a project planning scenario for human resources allocation, a user only exists if they have been or are currently assigned to a task. Currently, you are forced to create placeholder events like "Available for project allocation" if you want to show someone that has never been assigned to anything (like a new employee).

  • Something like scrollToDate() API is really needed.

  • It would be useful to have editable component attributes for setting the overall start date and end date of the timeline.

  • Clicking 'cmd' on a Mac/Firefox combo closes all timeline groups but the first one. Hard to make a screenshot this way.


2 Likes

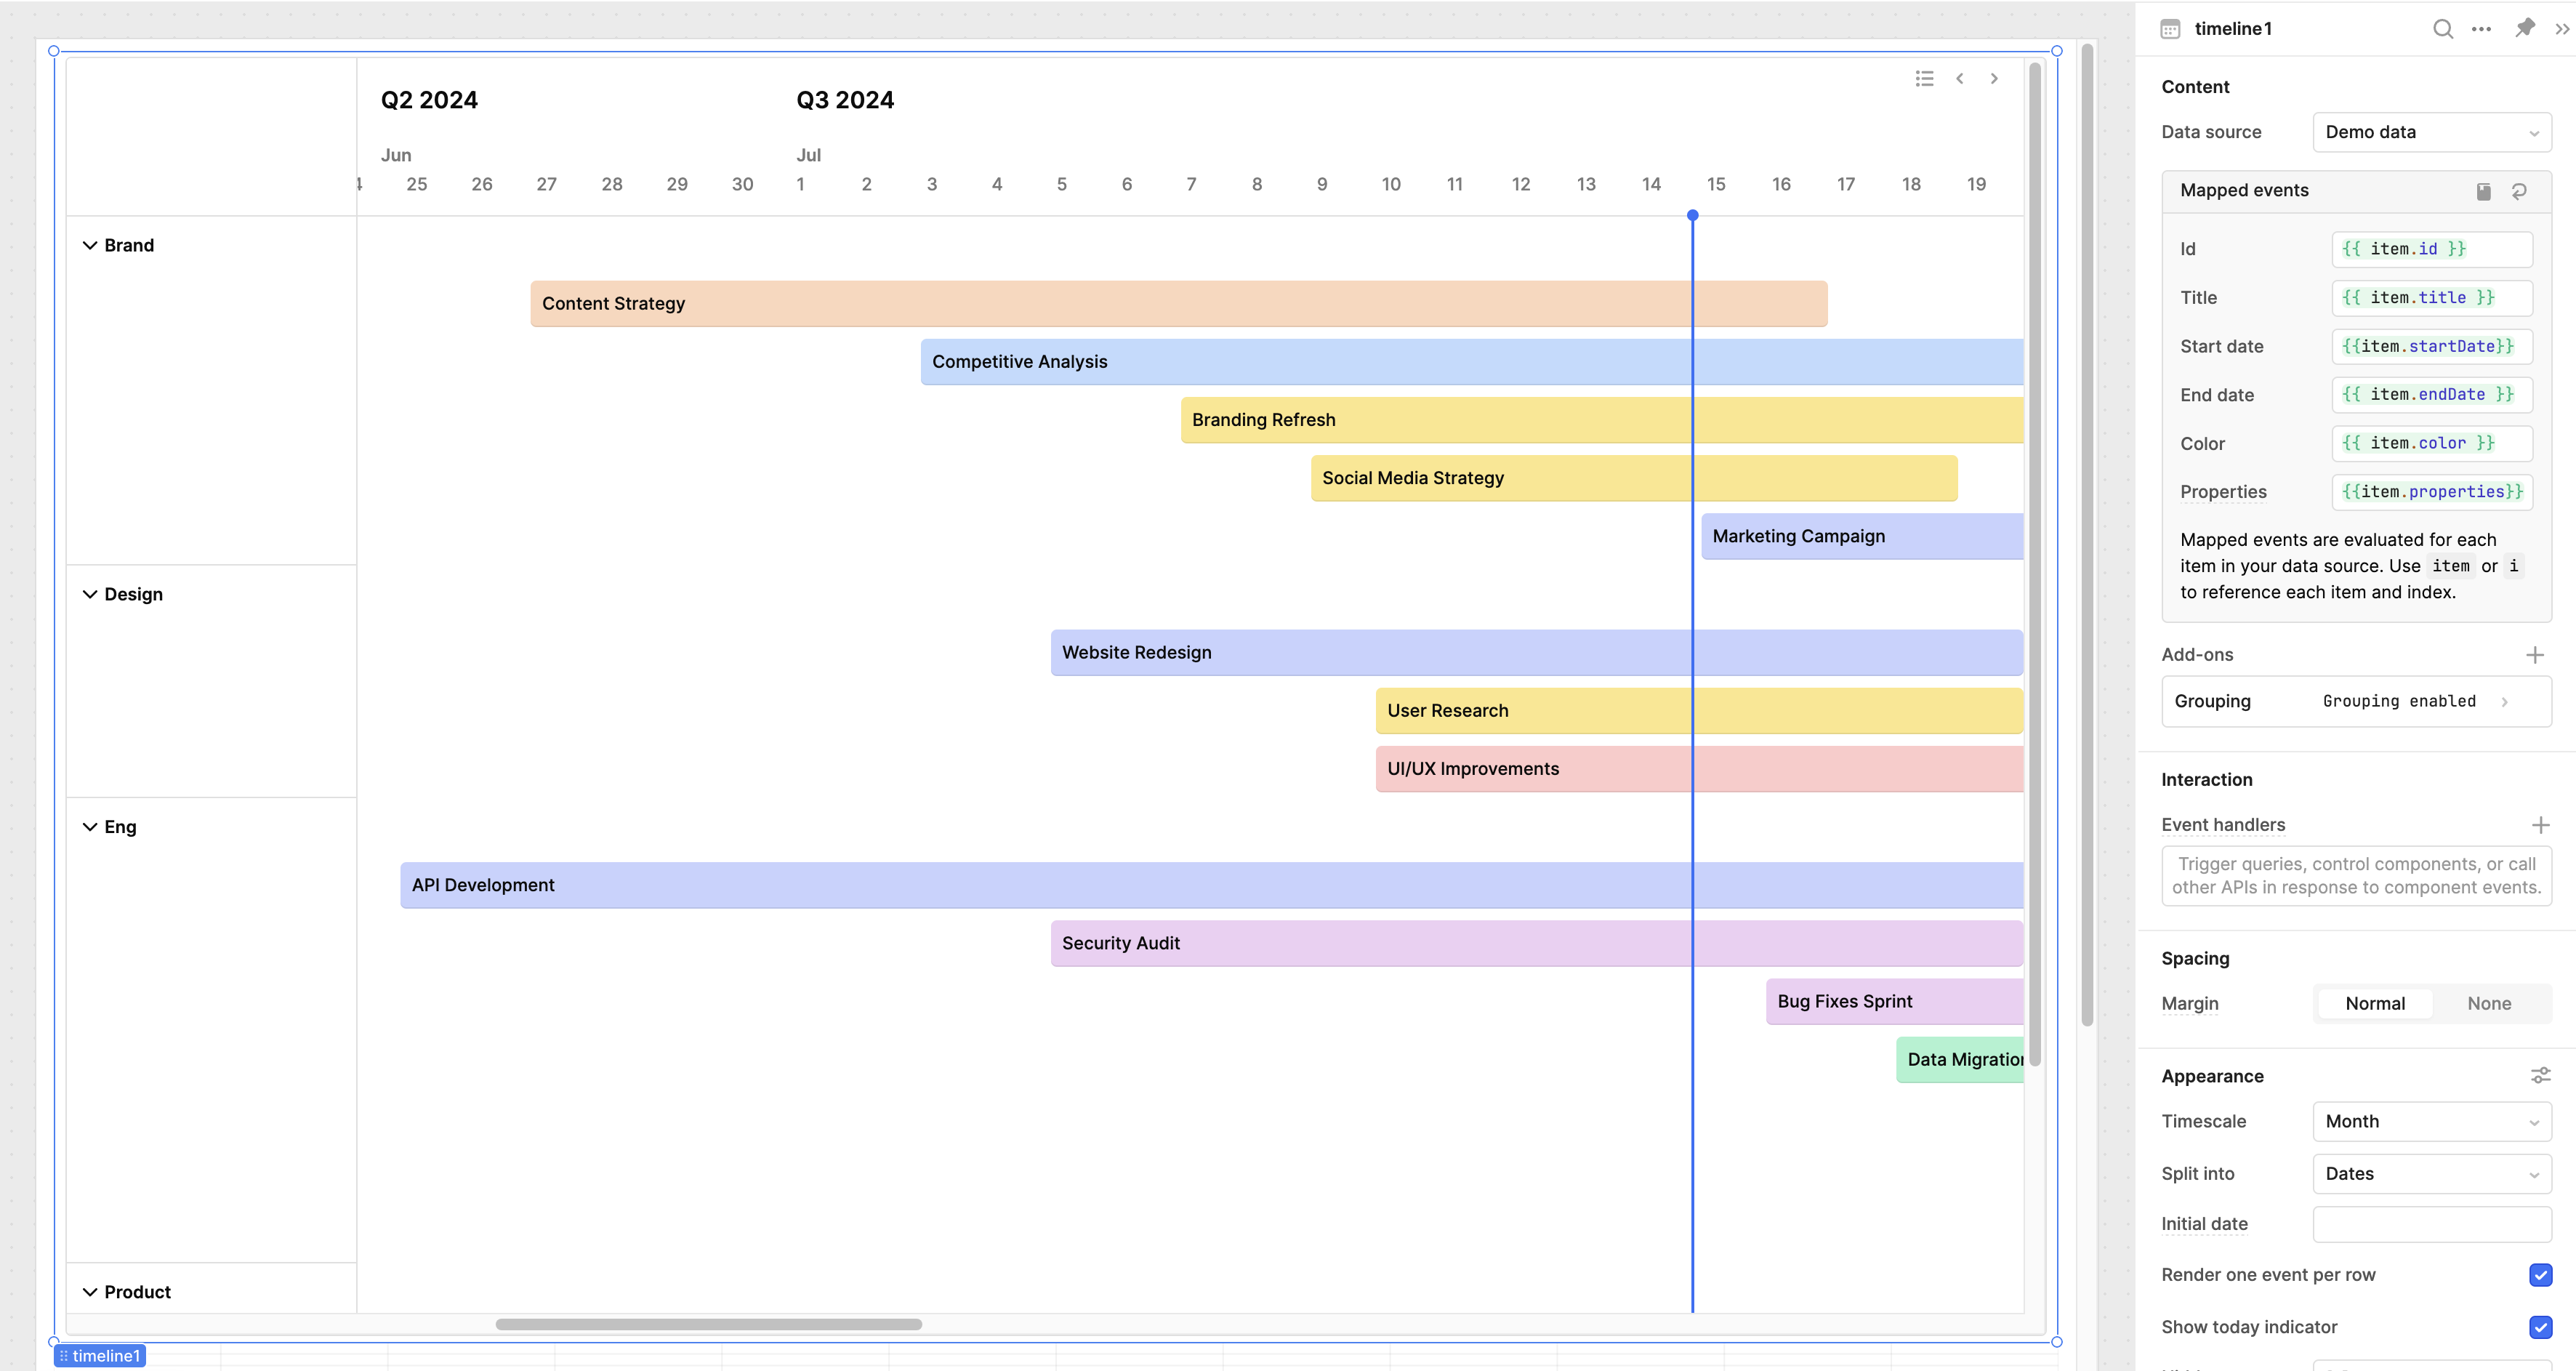
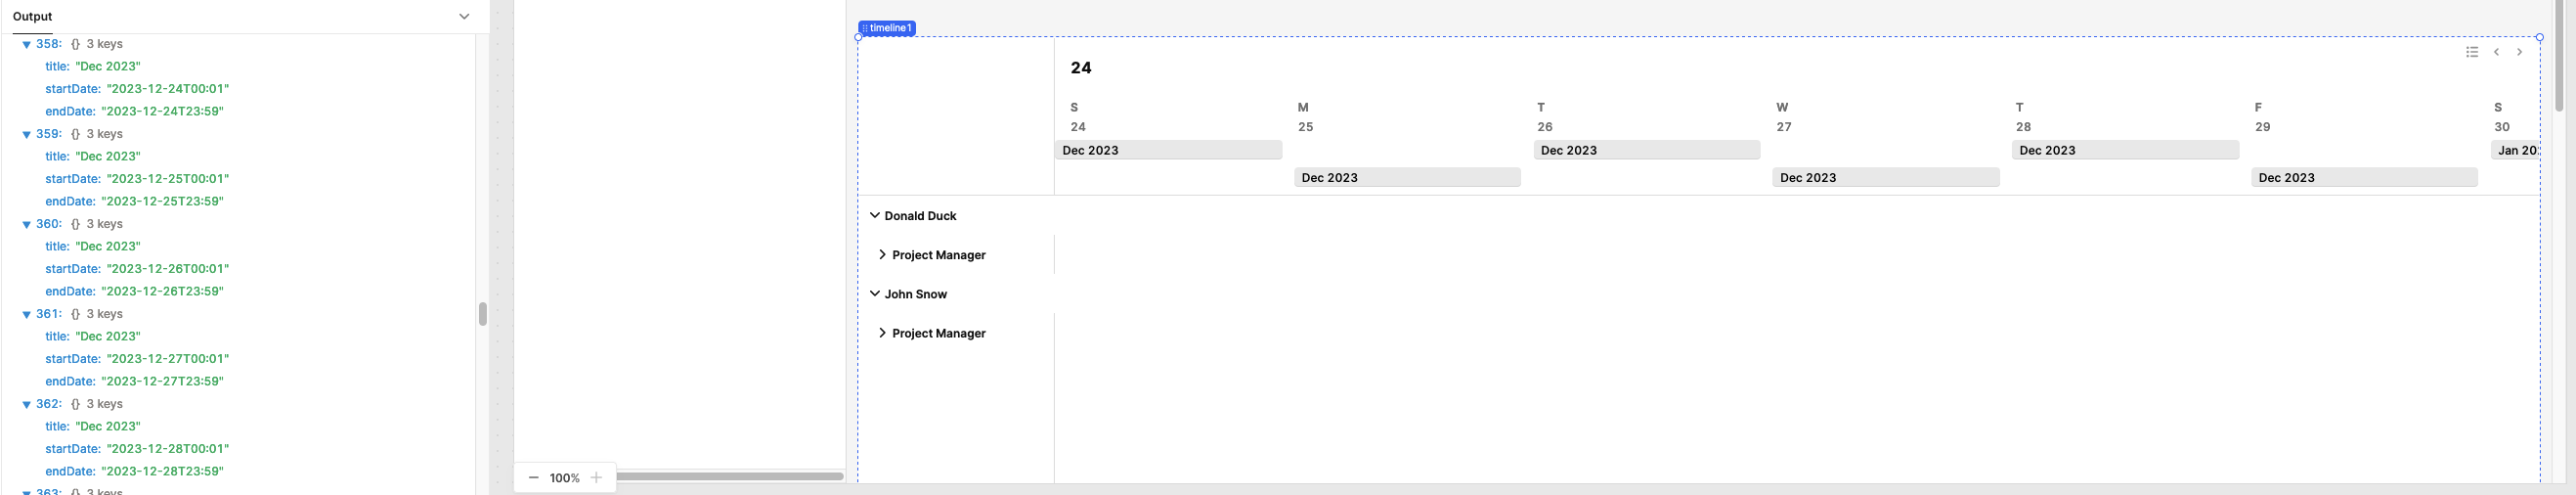
I've encountered another peculiar behavior with the timeline component in my project. Despite the fact that the data is correctly ordered in terms of array elements, IDs, titles, start dates, and end dates, the visualization displays the events in a non-sequential manner.

  • First Day: Events are displayed in the correct order.
  • Second Day: Events are displayed in reverse order.
  • Third Day: Events revert to being displayed in the correct order.
  • Fourth Day: Events are again displayed in reverse order.

This pattern alternates with each subsequent day: one day in proper order, the next in reverse order.

This issue occurs when the setting for "render one event per row" is disabled.

I leave here a dummy payload to test it out:

[
  {
    "id": 19,
    "title": "19",
    "startDate": "2024-09-02 09:00:01",
    "endDate": "2024-09-02 09:59:59",
    "color": "#aecc66",
    "properties": {
      "project": "My Project",
      "user": "Donald Duck"
    }
  },
  {
    "id": 20,
    "title": "20",
    "startDate": "2024-09-02 10:00:01",
    "endDate": "2024-09-02 11:59:59",
    "color": "#aecc66",
    "properties": {
      "project": "My Project",
      "user": "Donald Duck"
    }
  },
  {
    "id": 21,
    "title": "21",
    "startDate": "2024-09-03 09:00:01",
    "endDate": "2024-09-03 09:59:59",
    "color": "#aecc66",
    "properties": {
      "project": "My Project",
      "user": "Donald Duck"
    }
  },
  {
    "id": 22,
    "title": "22",
    "startDate": "2024-09-03 10:00:01",
    "endDate": "2024-09-03 11:59:59",
    "color": "#aecc66",
    "properties": {
      "project": "My Project",
      "user": "Donald Duck"
    }
  },
  {
    "id": 23,
    "title": "23",
    "startDate": "2024-09-04 09:00:01",
    "endDate": "2024-09-04 09:59:59",
    "color": "#aecc66",
    "properties": {
      "project": "My Project",
      "user": "Donald Duck"
    }
  },
  {
    "id": 24,
    "title": "24",
    "startDate": "2024-09-04 10:00:01",
    "endDate": "2024-09-04 11:59:59",
    "color": "#aecc66",
    "properties": {
      "project": "My Project",
      "user": "Donald Duck"
    }
  },
  {
    "id": 25,
    "title": "25",
    "startDate": "2024-09-05 09:00:01",
    "endDate": "2024-09-05 09:59:59",
    "color": "#aecc66",
    "properties": {
      "project": "My Project",
      "user": "Donald Duck"
    }
  },
  {
    "id": 26,
    "title": "26",
    "startDate": "2024-09-05 10:00:01",
    "endDate": "2024-09-05 11:59:59",
    "color": "#aecc66",
    "properties": {
      "project": "My Project",
      "user": "Donald Duck"
    }
  }
]

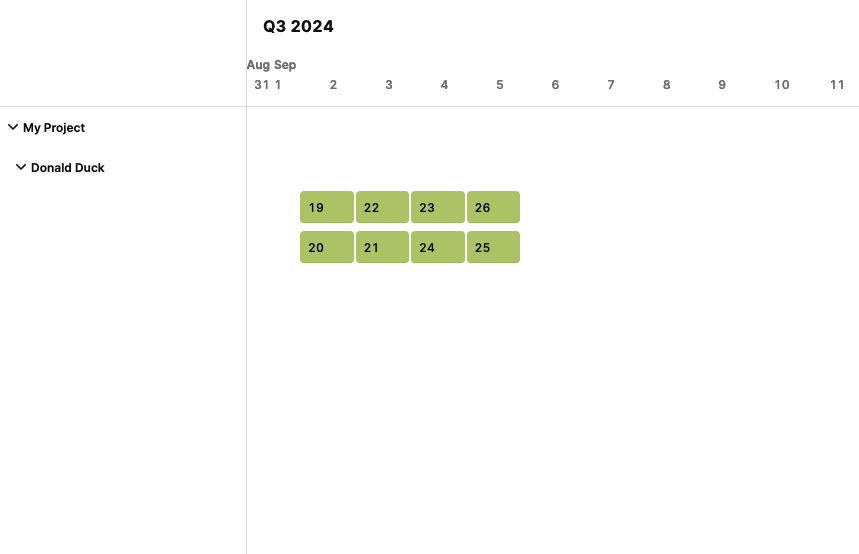
You can find attached a screenshot as well

In this case, i was able to use it as you suggested, but being able to set it using javascript would be really useful.

Was excited to use this instead of my janky custom vis.js component, but sadly Timeline component can't span multiple years :frowning:

custom component:

@Edoardo_Polito Thanks so much for the detailed feedback! I’ll make sure to surface this to the team so we can take a closer look.

Thanks for the feedback @trz-justin-dev. I'm curious about your use case. Could you clarify how many years your projects typically span? Is it something like 3 years, 5 years, or even longer?”

hey @nicos thanks for your reply!

yeah we’re using vis.js which allows horizontal scrolling — it automatically adjusts the time scale to fit the first and last event. but it is cumbersome to work around the model/modelUpdate in custom component.

it can span years, yes. for us we are showing where multiple trucking operators share contact info and trucks, indicating higher likelihood of fraud.

2 Likes