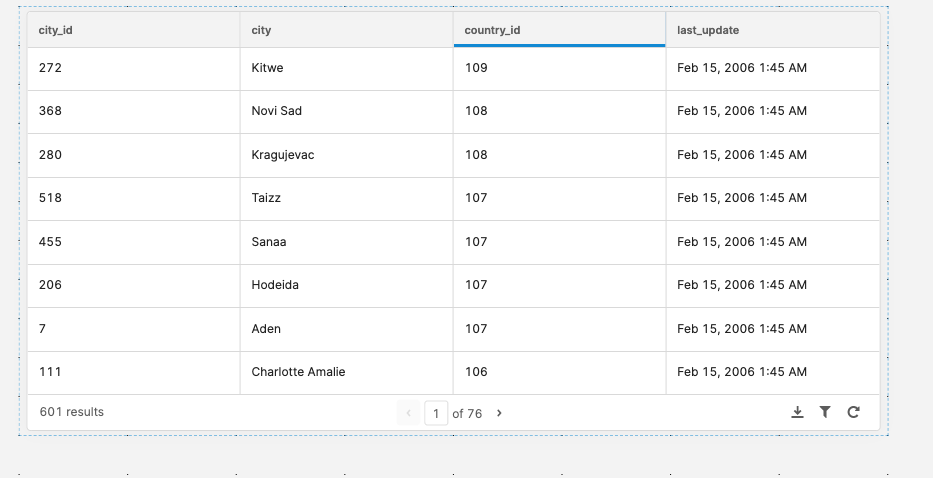
I have Mongodb Query which populates the table, from table i need to create a graph based on different column sorting ascending /descending.
When i tried to build graph based out of table data, i am getting all rows of the table, i just need subset of table data ( just top 5 records based on rank)
Wanted to build interactive graph which changes based on top 5 rank ascending/descending
sorry if it is very basic, i use entire table data as input to the plotly charts, wanted to build 2 different charts - one based on top 5 rank & other based on bottom 5 rank. So in order to sort , table data based on particular column, how would we do that?
{{table2.data}}
I want to sort the table data based on rank column , how to do that? Any help will be appreciated
Hi there! In order to achieve the functionality that you are looking for you will have to access some unique properties of the table component and use them in a custom javascript transformer. Unfortunately, at this time the actual data of the table does not change in tandem with the visual sorting that you see when you click on table column headers.
let data = formatDataAsArray({{table1.data}}) let order = {{table1.sort[0]}}
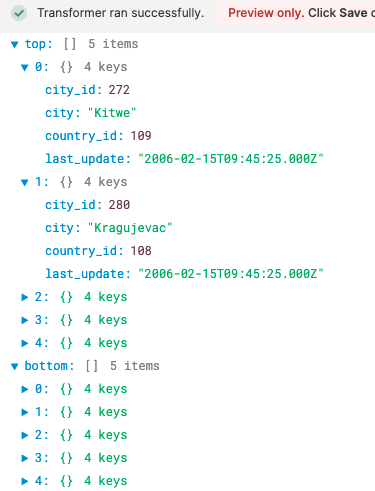
let top = sorted.slice(0, 5) let bottom = sorted.reverse().slice(0, 5)
return {top, bottom}
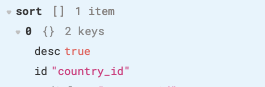
Here we are grabbing the sort property of the table which contains 2 keys (desc, id). The desc key is a boolean referencing whether the data is sorted in descending order, and id references the table column by which the table is sorted.
In the compare function that we pass to the sort function we are first checking the value of the desc key, and comparing the values accordingly. Now we have the data sorted the same way that it appears visually in your table. Here you can grab the top and bottom ranked rows to fit your needs!