Implement Net Promoter Scores for Shopify
Net Promoter Scores (NPS) provide a time-tested method of measuring customer experience. Numerous studies show the correlation to company revenue growth. (See the Harvard Business Review article The One Number You Need to Grow or google “net promoter score and revenue growth” to dig deeper.) It asks just one simple question: “How likely are you to recommend our products/services/company to a friend or colleague?" on a scale of 0 to 10. It puts customers into three categories: detractors, satisfied, and promoters. Detractors (response of 0 to 6) are scored a minus 1. Satisfied (response 7 or 8) are neutral and score a zero. Promoters (response of 9 or 10) are scored plus 1. Add the scores up, divide by the number of customers, multiply by 100 (to scale it from +/-100) and you have your Net Promoter Score.
We will build a net promoter survey that can be added as a link to Shopify order emails. The results will be recorded in google sheets. You will need a Shopify account, a retool account (professional edition or you can use a free trial), and a google account.
Part 1 Google Sheets
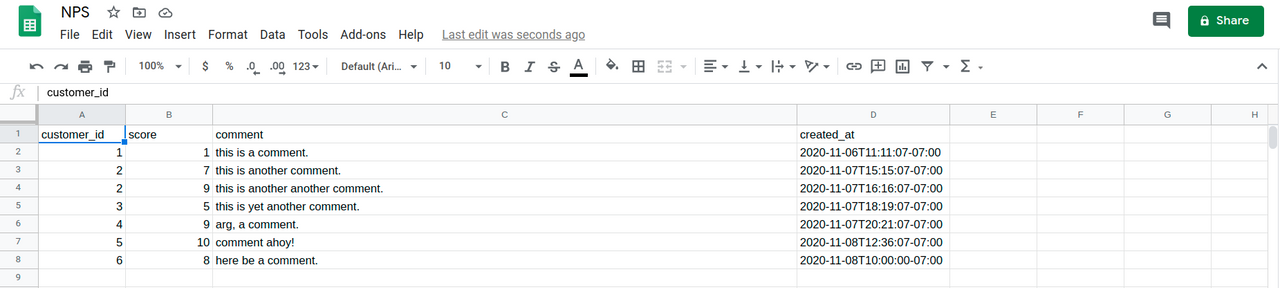
Let’s begin with google sheets, and create a new sheet called NPS.
It will have four columns:
customer_id, score, comment, created_at
Note that we use _ instead of spaces between words.
The header rows will look like below, but without any data in rows under the header row yet.
To access the google sheet we need to add it as a resource in retool.
On the retool home page, select resources.
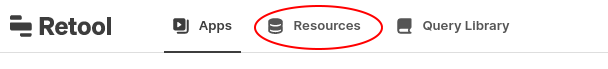
Select Google Sheets
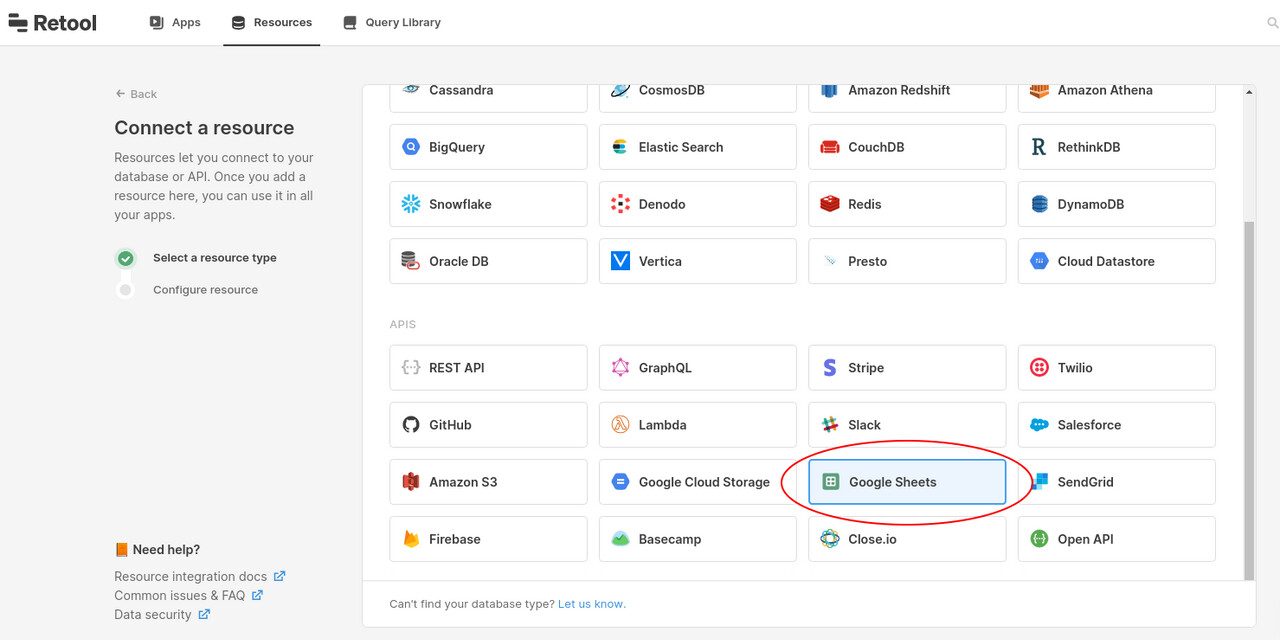
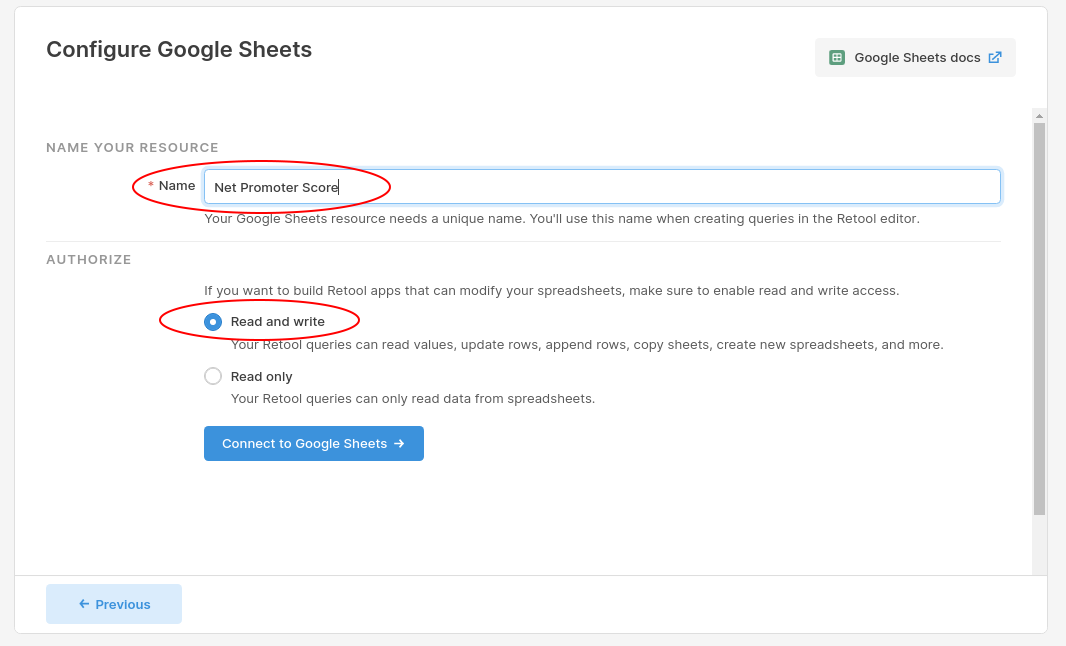
Name the resource Net Promoter Score, select Read and Write, then click “Connect to Google Sheets”.
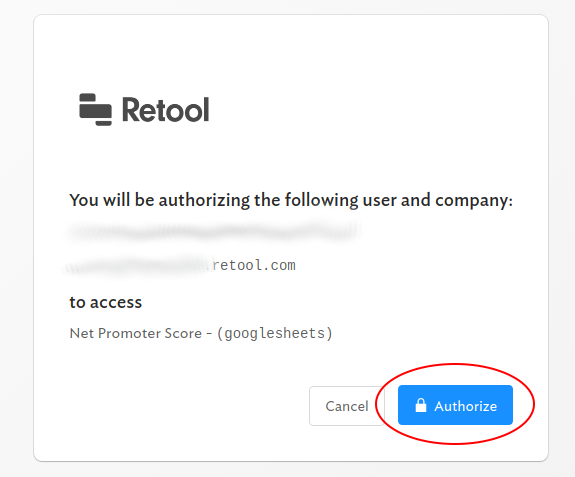
Click Authorize
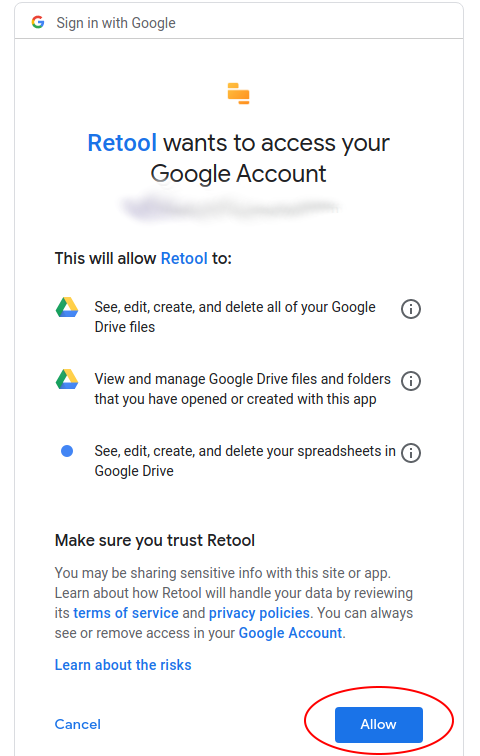
Click Allow to allow Retool access.
Click Save Changes.
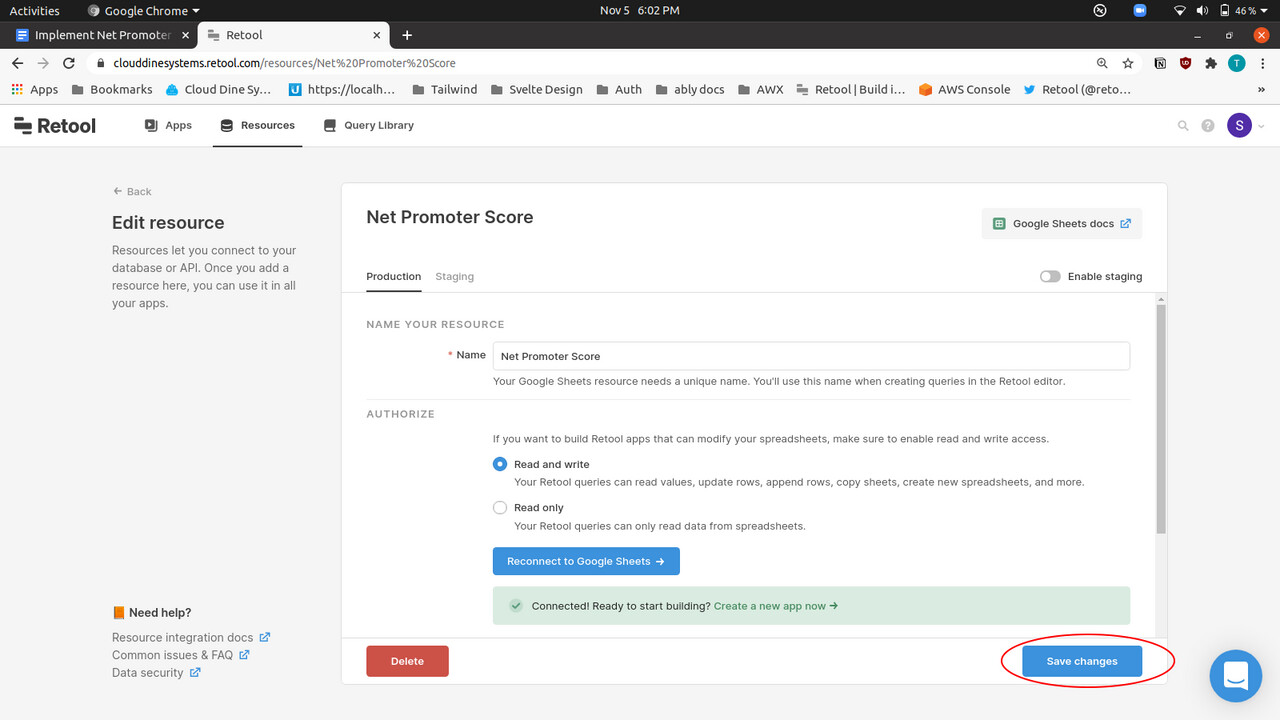
Now retool can read and write data to the NPS Google Sheet.
Part 2 Survey
Next, we’ll do the survey.
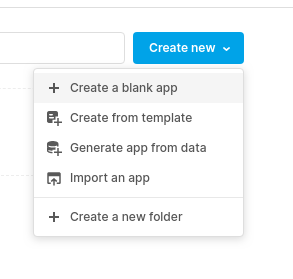
Login to retool and create a new app.
and name it nps. If there is a table already on the canvas, select it, delete (using the delete key) & confirm deletion in the popup.
Select “form” from the component list on the right
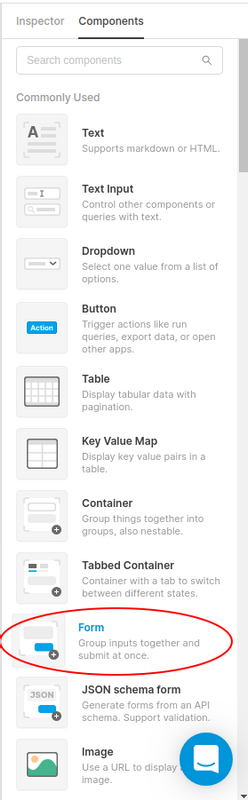
and drag it onto the canvas.
Expand it to fill most of the screen (we will need plenty of space for the 11 NPS score buttons) and also “toggle show on mobile” in the lower right.
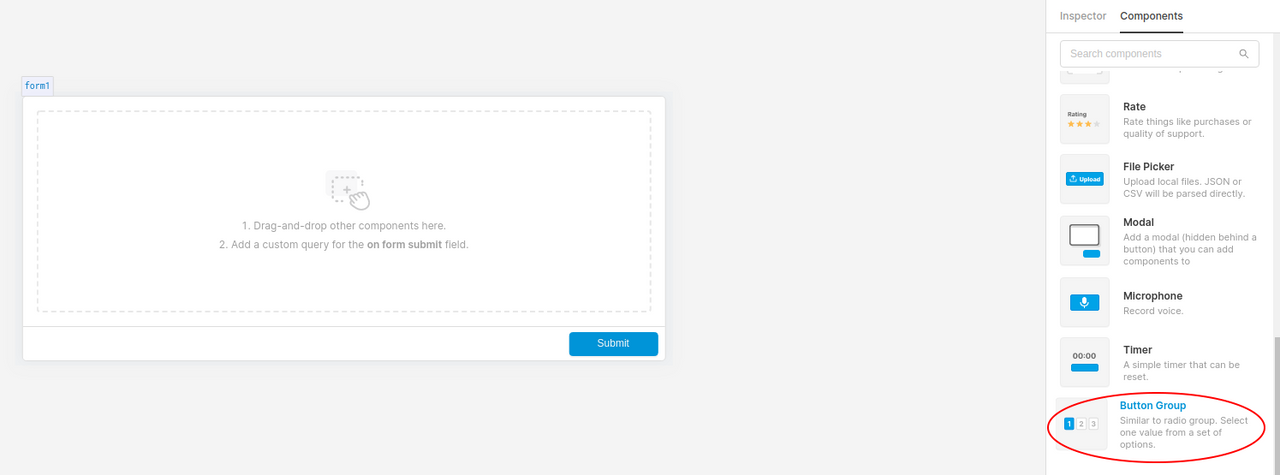
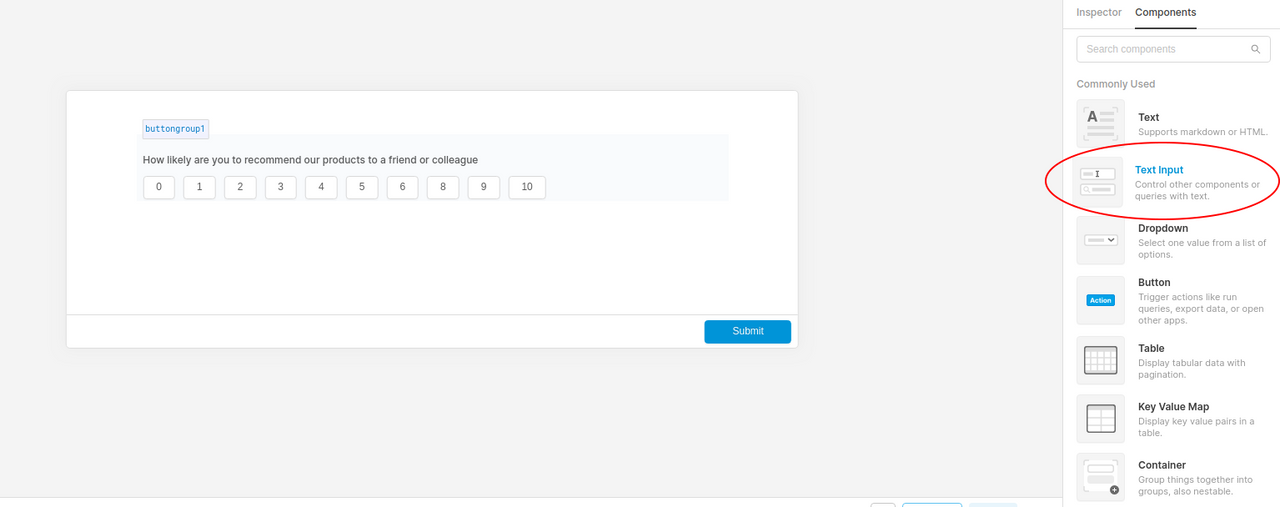
Now we add the buttons for the scores. From components, add a Button Group by dragging it onto the form.
For the button group, update the Label to
How likely are you to recommend our products to a friend or colleague?
Substitute "our company", "our services", or your company name for "our products" to suit your needs.
Update Values to
[0,1,2,3,4,5,6,7,8,9,10]
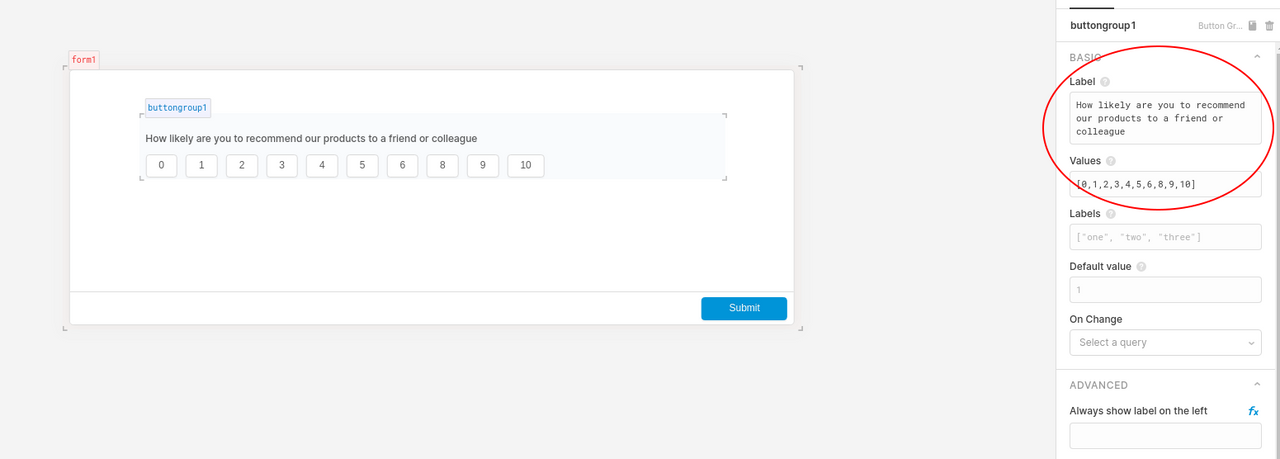
This creates the NPS score buttons.
We are going to add an optional comments text box. These are pure gold and I highly recommend adding them. They give details of why the customer scored you the way they did.
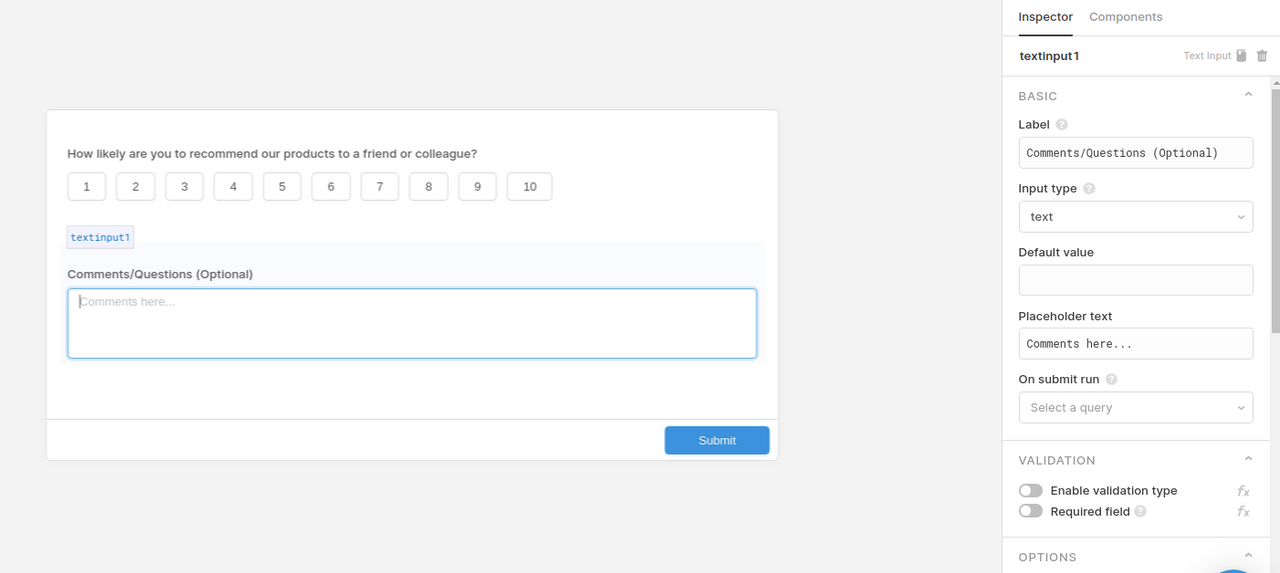
From Components, drag Text Input onto the canvas.
Update the Label
Comments/Questions (Optional)
and the placeholder
Comments Here…
and set true “show on mobile”.
We are almost done with the survey.
How do we know which customer filled out the survey? To send the survey to customers, we will need the public url of the survey. (This will be for customers that place a new order via Shopify.) We will later modify this add the Shopify customer id.
Go to Share
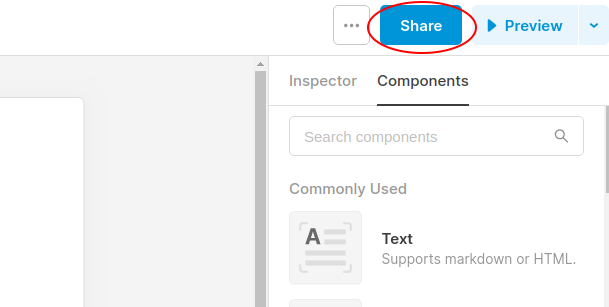
A modal will popup. Click Public and “Share Public Link”.
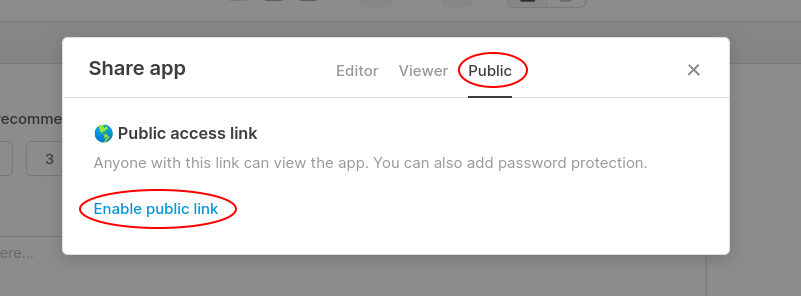
Copy the public access link url. We will need this for part 3.
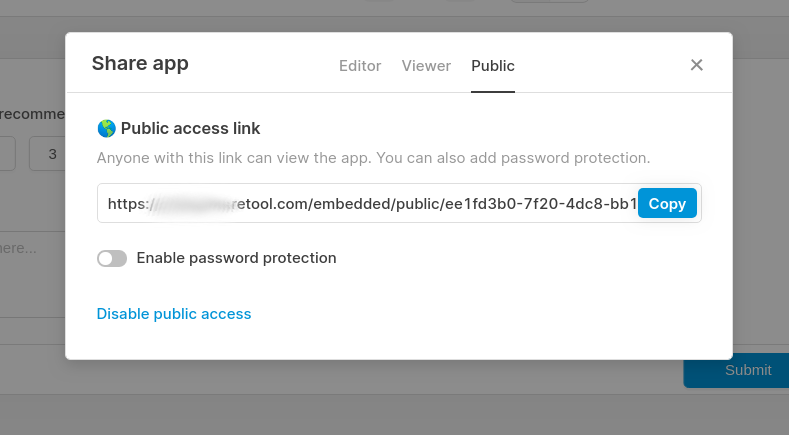
Close the modal and save your survey.
Part 3 Shopify Email
To differentiate between the customers, we will use a customer id that Shopify assigns.
We will combine the url we copied in the earlier step with the Shopify customer id. Retool can then save this customer id along with survey data. If our url was
https://your-app-here.retool.com/embedded/public/ee1fd3b0-7f20-4dc8-bb1d-28ed57bf2103
we will add
?customerid=12345
to the end.
In this case the Spotify customer id is 123456. Shopify will provide the 123456 number for us. It is the customer id in their system. We aren’t using customer_id or customer-id because of personal preference. (Google doesn't recommend _ in urls. - can be interpreted as the minus operator in calculations which can cause unexpected results.)
(In the instructions below use your own url instead of https://your-app-here.retool.com/embedded/public/ee1fd3b0-7f20-4dc8-bb1d-28ed57bf2103).
Here are the instructions on how to include the survey url at the end of a new order email template. (Based on https://help.shopify.com/en/manual/orders/notifications/order-notifications#include-special-instructions.) This current as of November 2020, but is subject to change anytime by Shopify. Similar steps could be used for other Shopify originated emails.
Steps:
-
From your Shopify admin, go to Settings > Notifications.
-
In the "Email Templates" section, click New order.
-
At the bottom of the New order email template, add the following code:
How did we do? Take our survey: https://your-app-here.retool.com/embedded/public/ee1fd3b0-7f20-4dc8-bb1d-28ed57bf2103?customerid={{ customer.id }}
If you like to customize the link text use the following or whatever suits your needs.
How did we do?
<a href="https://your-app-here.retool.com/embedded/public/ee1fd3b0-7f20-4dc8-bb1d-28ed57bf2103?customerid={{ customer.id }}">Take our survey</a>
which shows up as
How did we do? Take our survey
- Click Save.
That’s it for setting up Shopify. The new order email will now include a survey link and provide a customer id that we use to differentiate different customer responses.
Part 4 Record Survey
We will create a query to save the survey data. Select your retool survey app nps and click edit.
A query1 is already created for you by default when you created the app. Select it.
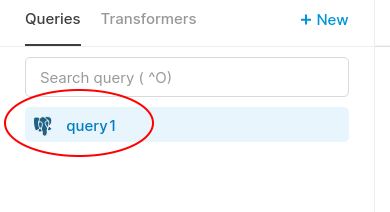
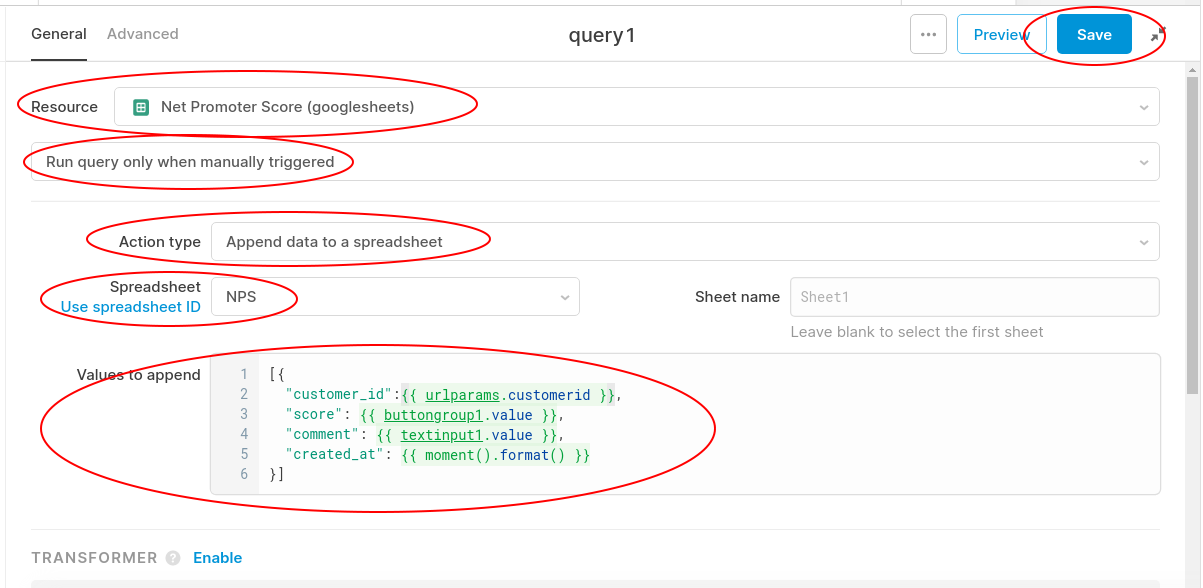
Let’s configure query1.
- Set Resource to
Net Promoter Score (googlesheets) - Select
Run query only when manually triggered - Set Action type to
Append data to a spreadsheet - Set Spreadsheet to
NPS - Set Values to append to the following:
    [{
      "customer_id":{{ urlparams.customerid }},
      "score": {{ buttongroup1.value }},
      "comment": {{ textinput1.value }},
      "created_at": {{ moment().format() }}
    }]
This will add a new row in the Google sheet with entries for the customer_id, score, comment, and created_at columns.
The parts within the {{ }} are variables and evaluated when query1 is run.
Here's what the Values are:
urlparams.customerid is from the ?customerid=12356 we set up in Shopify email. It is passed to the survey.
buttongroup1.value is the number of the button selected for the nps rating.
textinput1.value is the text from the comment box.
moment().format() is the time currently, then formatted into a universal format (ISO 8601 format).
- Click Save to save query1.
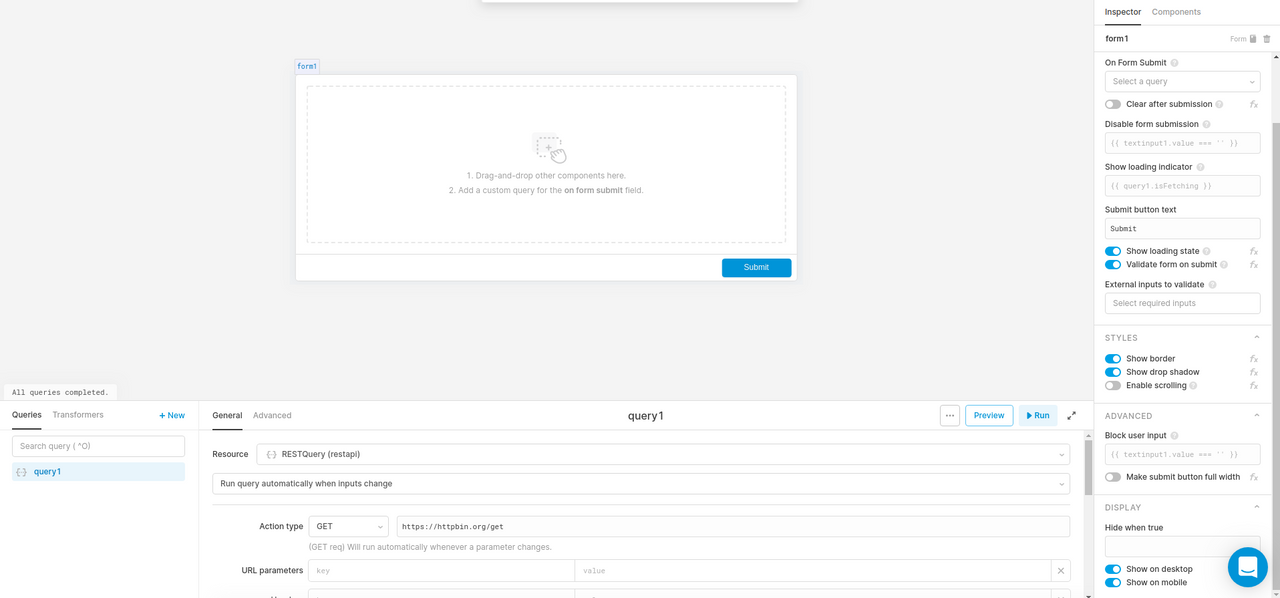
For step 7, we have one last bit to tie it together. We need query1 to run and save the survey data when someone submits a survey.
7. Set form1 “On Form Submit” to query1.
Click form1 on the main canvas.
Set On Form Submit to query1.
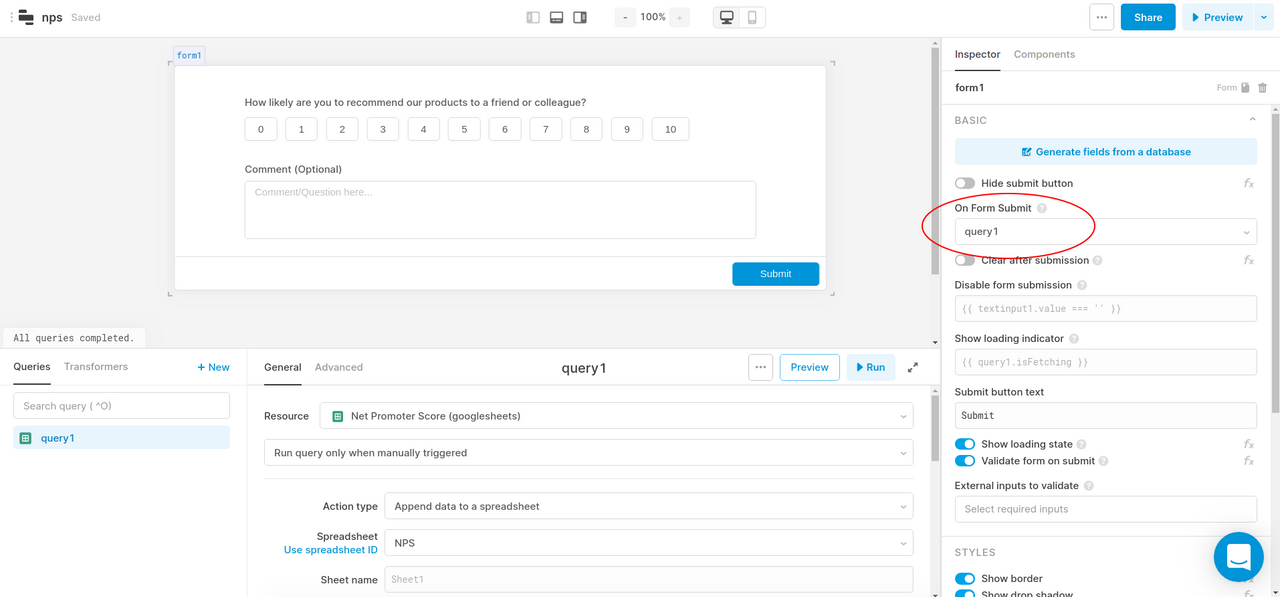
That finishes out recording the survey.
In case you were wondering, where did we get urlparams that we used in Values?
When you are editing the survey, it has a url like https://your-account-name-here.retool.com/editor/nps. To emulate the survey link to something similar to the Shopify email, let’s add
?customerid=123456
to the end of the https://your-account-name-here.retool.com/editor/nps url. For example it would look like, https://your-account-name-here.retool.com/editor/nps?customerid=123456. Or from a screenshot
![]()
After you add this, reload your browser.
Now open the left panel by clicking the left panel icon. (It's near the top in the middle.)
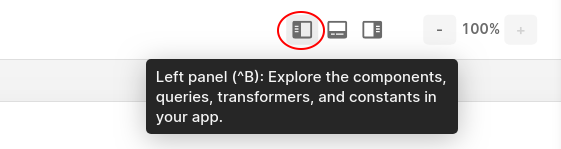
Expand GLOBALS urlparams
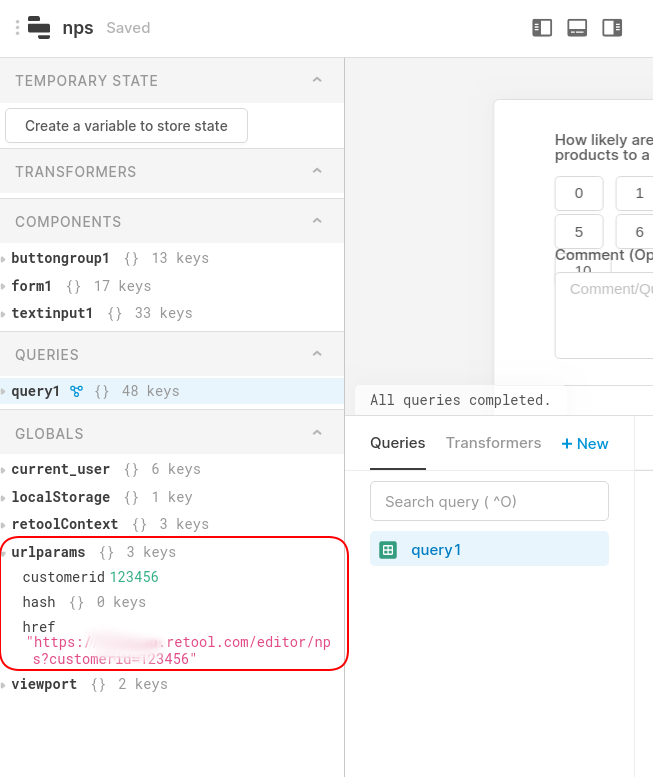
Wow! It has the customerid that we set manually by adding ?customerid=123456. Look at Retool Docs if you like to know more about the variables that can be used.
After we configured the Shopify new order emails in the earlier step, it will instead use the customerid that Shopify provides when customers click the survey link.
You can go back to the regular https://your-account-name-here.retool.com/editor/nps now.
Part 5 Calculate and Graph NPS
Create a new blank app called NPS Dashboard.
We will use a statistic component, a pie graph component, and a table component. We’ll use a "transform" to calculate the NPS stats. Below is what it will look like.

Let’s start with the table that comes with a new app.
Click the table. We will change the query1 it uses.
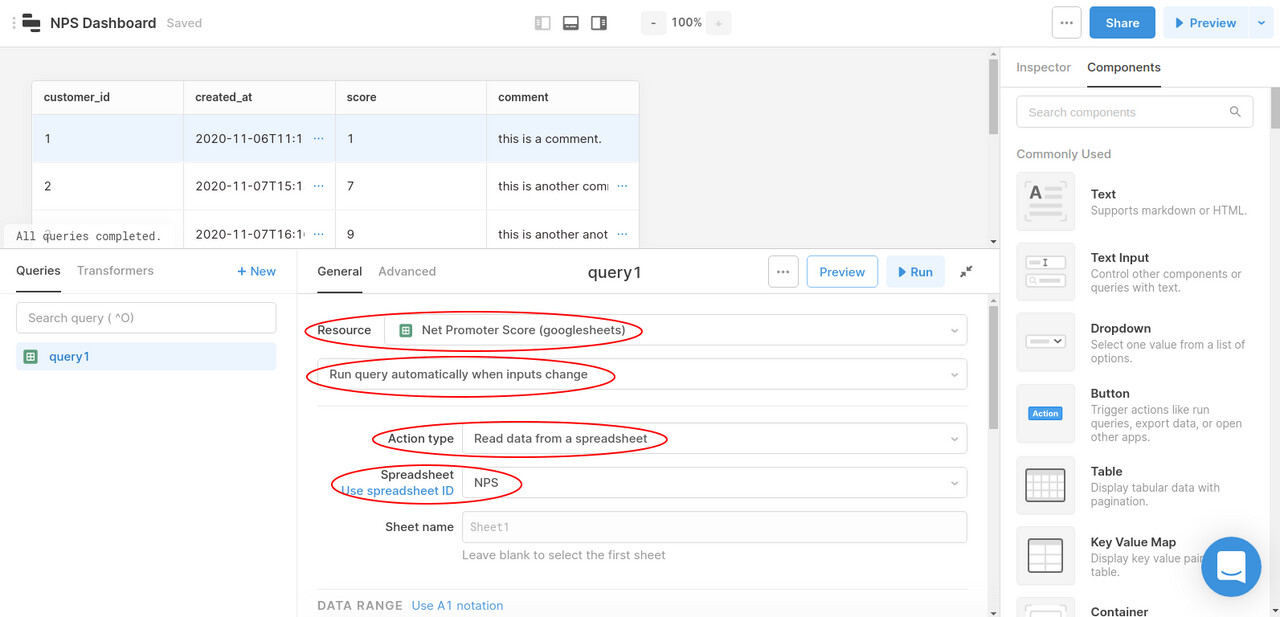
For query1:
Set Resource to Net Promoter Score
Set Run query automatically when inputs change
Set Action type Read data from a spreadsheet
Set spreadsheet to NPS
Save and Run.
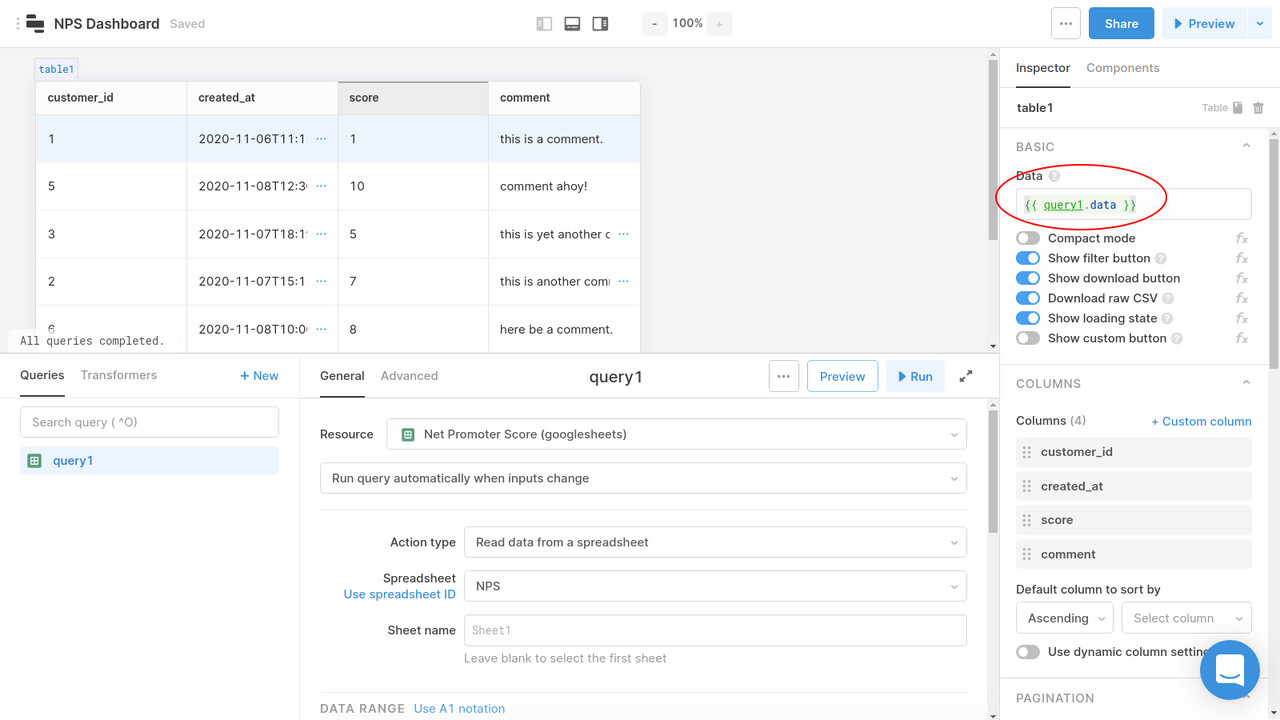
Now click the table and make sure table1 data is set to {{ query1.data }}.
Now let’s calculate the NPS stats.
Click transformation then + New.
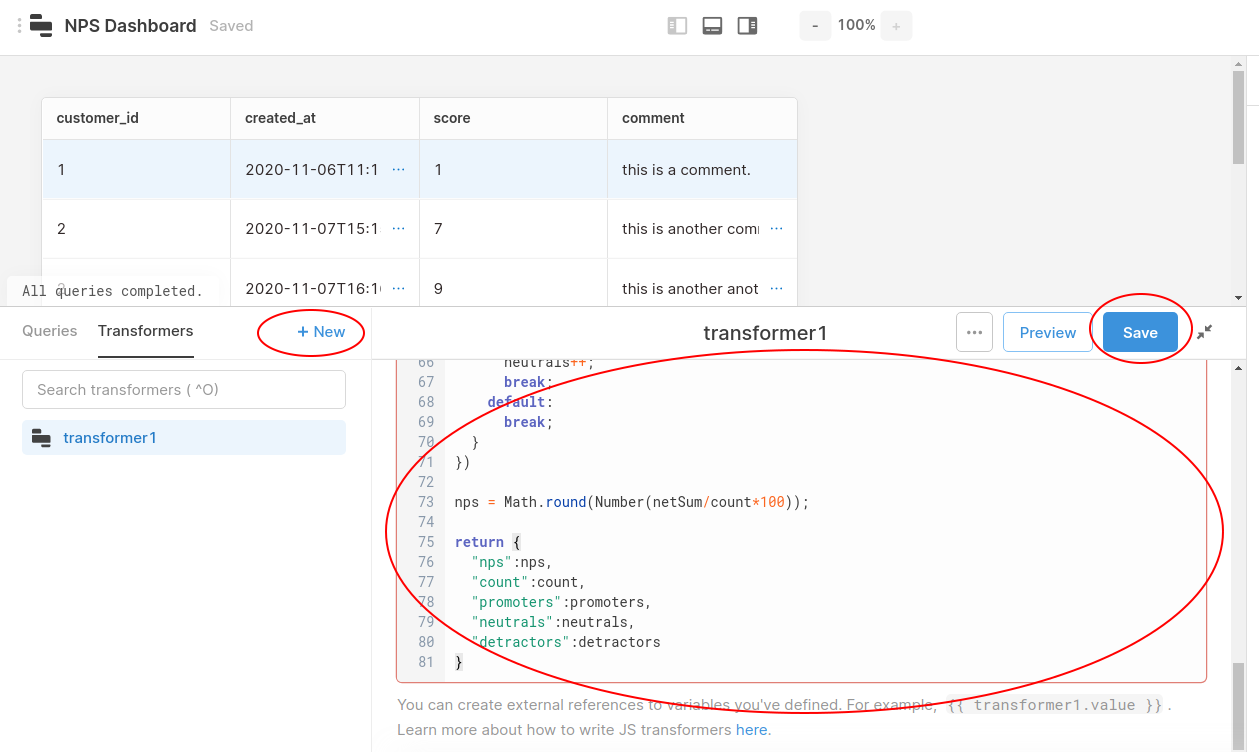
And paste in the code below and save. In short, it loops through the query1.data rows from the NPS Google sheet, and stores the net nps score, what type of score it is, the customer id and time of each survey. It only stores one score per customer. If there is a newer survey for a customer, it replaces the older one. Finally, it loops through all the data again; calculating the total NPS score along with aggregating the number of customers and type of scores.
let promoters = 0
let neutrals = 0
let detractors = 0
let count = 0
let netSum = 0
let nps = 0
let myMap = new Map();
const data = {{ query1.data }};

const calculateNet = (score) => {
  //don't calculate totals here because could double count a customer.
  let net;
  if (score <= 6){
    //0,1,2,3,4,5,6 detractors
    net = -1
  } else if (score >= 9){
    //9,10 promoters
    net = 1
  } else {
    //7,8 neutral
    net = 0
  }
  return net
}

//only want to count once per customer id.
//using Map to store one entry per customer id.
data.forEach((element, index) => {
  if (myMap.has(element.customer_id)){
  	//existing. only use the newest score
    const existing = myMap.get(element.customer_id);

    if (moment(element.created_at).isAfter(moment(existing.created_at))){
      //newer. replace existing with a later date.
      myMap.set(element.customer_id,{
        "customerid":element.customer_id,
        "score": element.score,
        "created_at": element.created_at,
        "net": calculateNet(element.score)
      })
    }
  } else {
  	//no existing. add it.
    myMap.set(element.customer_id,{
      "customerid":element.customer_id,
      "score": element.score,
      "created_at": element.created_at,
      "net": calculateNet(element.score)
    })
  }
})

//calculate the count, sum of net and other stats
myMap.forEach(mapElement => {
  count += 1
  netSum += mapElement.net
  switch (mapElement.net){
    case  1:
    	promoters++;
			break;
    case -1:
    	detractors++;
      break;
    case 0:
    	neutrals++;
      break;
    default:
      break;
  }
})

nps = Math.round(Number(netSum/count*100));

return {
  "nps":nps,
  "count":count,
  "promoters":promoters,
  "neutrals":neutrals,
  "detractors":detractors
}
This will give us an nps score, the number of records, promoters, neutrals, & detractors.
It will yield something like the following:
nps:17
count:6
promoters:3
neutrals:1
detractors:2
Create a new statistic component
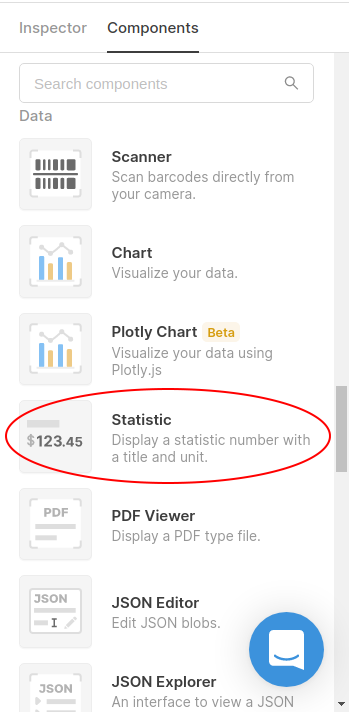
Drag it above the table.
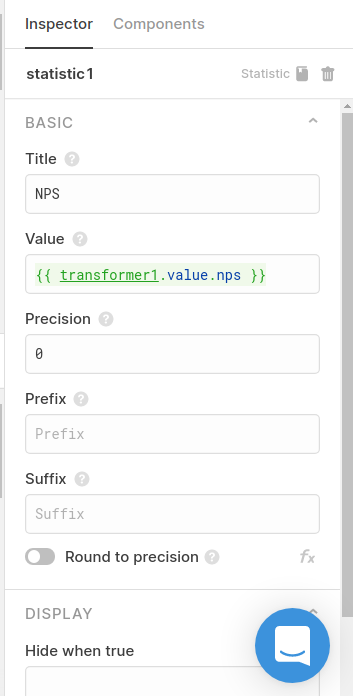
Select the statistic1 component and set the following:
Title: NPS
value : {{ transformer1.value.nps }}
Precision: 0
Prefix:
Suffix:
Round to precision: false
transformer1.value is what is returned by the transform (The code we pasted in earlier.) We want the nps score, hence transformer1.value.nps.
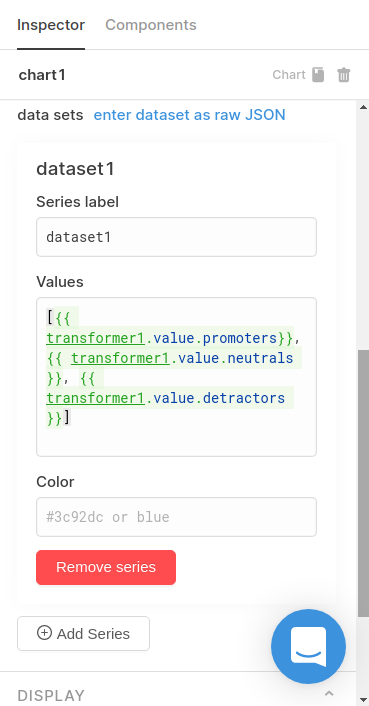
Now drag a chart component above the table.
Select it and set the following:
Labels ["Promoters","Neutrals","Detractors"]
Chart Type Pie Chart
Cutout Percentage 0
Series label dataset1
Values
[
  {{ transformer1.value.promoters}},
  {{ transformer1.value.neutrals }},
  {{ transformer1.value.detractors }}
]

That’s it!
There’s a number of ways to extend this example.
Other Stores
If you have stores on other platforms like Etsy, Wix, Squarespace, etc…, you can use the same technique to create and track NPS data from them as well.
Other Events
This survey was setup for new order emails. It could be used for other events to measure NPS across other parts of the customer journey.
Cohorts
This example tracks the most current NPS. (It only uses the most recent survey result for a customer.) You could group by when a customer first bought your product/service to create cohort analysis. E.g. all customers that first bought in November have an additional column "cohort" with value "202011". This grouping could be graphed to highlight cohort activity.
Individual Scores Over Time
You could add time series graphs per customer to see how an individual customer’s NPS has changed over time.
These are just a few of the possibilities of what you can do to measure and display your customer's net promoter scores. It is a powerful tool that every company should have in their tool belt.
Toolmakers, on your mark, get set, create!
Thaddeus