Hi there,
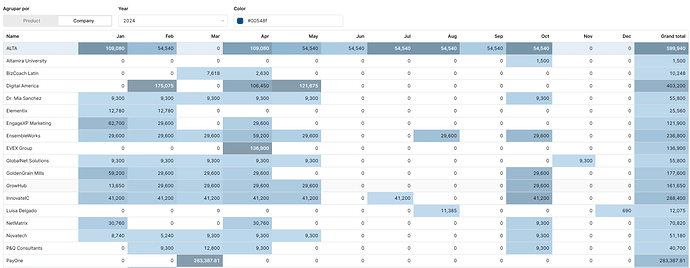
I was recently able to set a HeatMap in a retool table, which allowed me to move away from a custom component.
I wrote this quick guide, accompanied by a YouTube video AND the [json file](Heatmap Table (2).json (51.1 KB)) (disclaimer: all names of companies are generic so no data has been shared) you can upload to see in your retool account.
Steps are simple:
- SQL query with your data
- Transform data to put Months as columns
- Get Minimums and Maximums from each column
- Create a Global Function to define the color of the column, using HUE logic
- BONUS: Allow users to pick the color they prefer and integrate this into the function
Here's the video tutorial as well:
SQL query
Create a query to pull from your database.
Your query should select AT LEAST the following elements:
- An amount column
- A date column
- A name that will be the column most to your left
My example, which I have called getPayments.data is as follows:
SELECT
  i.invoice_date,
  i.invoice_total AS amount,
  p.name as product_name,
FROM
  ps1.invoices i
  LEFT JOIN ps1.leads l ON l.id = i.lead_id
  LEFT JOIN ps1.products p ON p.id = (l.products->>0)::int
WHERE
  i.status = 'paid'
  AND EXTRACT(YEAR FROM i.payment_date) = {{ year1.value }};
Within the "transform results" section of your query you must add return formatDataAsArray (data)
Transform data to put Months as columns
Create a Transformer that will manipulate your first query's data. This query will create rows, and for each row it will add all months of the year, and if there is an amount for that row then it will use that, otherwise it will add 0. This is to ensure you get columns for all of your months, even if there is no data.
I've called this getPaymentsTable. Here's the code:
var data = {{ getPayments.data }};

// Generate the template for all fields
var templateOBJ = {
  name: "",
  grandTotal: 0,
  ...Object.fromEntries(Array.from({ length: 12 }, (_, i) => [new Date(0, i).toLocaleString('eng', { month: 'short' }), 0])) // Dynamically generate months
};

// Process data and build grouped product structures
var outputArray = [];

data.forEach((item) => {
  // Extract necessary fields from the item
  const productName = item.product_name;
  const date = new Date(item.invoice_date); // Convert invoice_date to a Date object
  const monthName = date.toLocaleString('eng', { month: 'short' }); // Get abbreviated month name in English
  const amount = parseFloat(item.amount) || 0; // Convert amount to a number

  // Check if the product already exists in the outputArray
  let existingProduct = outputArray.find(e => e.name === productName);

  if (!existingProduct) {
    // If the product does not exist, create a new entry
    var product = { ...templateOBJ }; // Initialize with the template
    product.name = productName;       // Set the product name
    product[monthName] = amount;      // Set the amount for the specific month
    product.grandTotal = amount;      // Initialize grandTotal with amount
    outputArray.push(product);        // Add new product to outputArray
  } else {
    // If the product exists, update its amount and grandTotal
    existingProduct[monthName] = (existingProduct[monthName] || 0) + amount; // Increment the month value
    existingProduct.grandTotal += amount;                                   // Update grandTotal
  }
});

// Ensure all months are present for each product
outputArray.forEach(product => {
  Object.keys(templateOBJ).forEach(key => {
    if (!(key in product)) {
      product[key] = 0; // Set missing months to 0
    }
  });
});

// Sort the output array by product name
outputArray.sort((a, b) => a.name.localeCompare(b.name));

// Return the final output array
return outputArray;
You can change the Locale to your local language, I for instance use es for Spanish.
You can now add a table component and use the result of this query as your data source.
Get Minimums and Maximums
Create another transformer that will go through each column and fetch the max and the min values. This will be used to assign colors to them. I've called this getPaymentsMaxMin. Here's the code:
const data = {{ getPaymentsTable.value }};

// Extract month names dynamically in Spanish abbreviated format
const monthNames = Array.from({ length: 12 }, (_, i) => new Date(0, i).toLocaleString('eng', { month: 'short' }));

// Initialize result object
const result = {};

// Iterate over each month name to compute max and min values for each month
monthNames.forEach(month => {
  const values = data.map(item => item[month] || 0).filter(value => value !== 0); // Get all values for this month, excluding 0

  result[`max_${month}`] = Math.max(...values); // Max value for the month
  result[`min_${month}`] = values.length > 0 ? Math.min(...values) : 0; // Min value for the month, or 0 if no values
});

// Calculate max and min for the grandTotal key
const grandTotalValues = data.map(item => item.grandTotal || 0).filter(value => value !== 0); // Get all grandTotal values excluding 0
result.max_grandTotal = Math.max(...grandTotalValues); // Max grandTotal
result.min_grandTotal = grandTotalValues.length > 0 ? Math.min(...grandTotalValues) : 0; // Min grandTotal, or 0 if no values

return result;
Don't forget to update your Locale to the same language you used in the previous transformer.
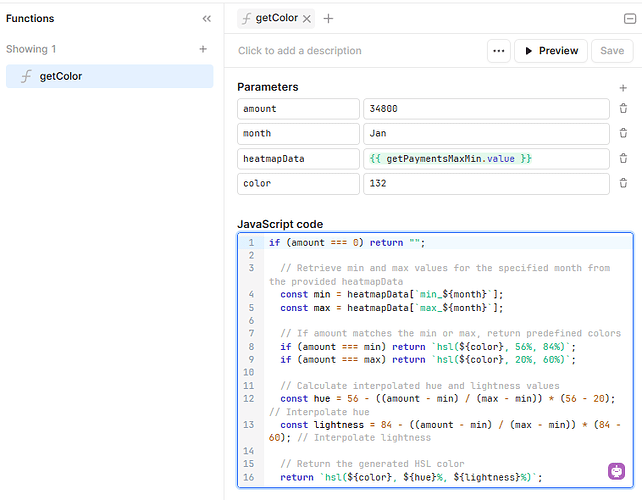
Create a Global Function that will be used in the column background setting
This is using the beta Sync Functions mentioned here.
Create a function and add 3 parameters:
- amount
- month
- heatmapData
Write your function (I called it getColor):
if (amount === 0) return "";

  // Retrieve min and max values for the specified month from the provided heatmapData
  const min = heatmapData[`min_${month}`];
  const max = heatmapData[`max_${month}`];

  // If amount matches the min or max, return predefined colors
  if (amount === min) return `hsl(132, 56%, 84%)`;
  if (amount === max) return `hsl(132, 20%, 60%)`;

  // Calculate interpolated hue and lightness values
  const hue = 56 - ((amount - min) / (max - min)) * (56 - 20); // Interpolate hue
  const lightness = 84 - ((amount - min) / (max - min)) * (84 - 60); // Interpolate lightness

  // Return the generated HSL color
  return `hsl(132, ${hue}%, ${lightness}%)`;
Now, I only was able to create the above thanks to @Dan-Kaplan 's implementation on another post. It took me a while to understand how this calculation happened. As I'm no expert, I'll share what ChatGPT had to say:
The calculation for the interpolated hue and lightness values in the code is based on a linear interpolation between the minimum (min) and maximum (max) values for a given month.
Let's break it down step by step:
1. Interpolated Hue Calculation:
const hue = 56 - ((amount - min) / (max - min)) * (56 - 20);
- Purpose: The hue value represents the color intensity, and it is being calculated to scale between two values:
- A higher hue value represents a color closer to green (
hsl(132, ...)), and - A lower hue value represents a color closer to yellow-green (
hsl(126, ...)).
- A higher hue value represents a color closer to green (
Formula Explanation:
(amount - min) / (max - min)is the normalized position of theamountwithin the range ofmintomax. It calculates how far theamountis from the minimum value as a percentage (from 0 to 1).(56 - 20)is the range of hues you want to map to, fromhsl(132)tohsl(126)(a color spectrum that goes from greenish to yellow-green). This gives a range of 36.- The final calculation
56 - ((amount - min) / (max - min)) * (56 - 20)is then linearly scaling theamountto fit between 56 and 20 based on its normalized position.
Example:
- If
amountis equal tomin, the formula would return 56 (greenish). - If
amountis equal tomax, the formula would return 20 (yellow-green).
Thank you ChatGPT....
You can add example values to your parameters to see the result, e.g. 34800, Jan, {{ getPaymentsMaxMin.value }}
Add the function to each of your columns in your table
Go to each column, and in the background setting call the Function, e.g. for the Jan column you will write.: {{ getColor(item,"Jan", getPaymentsMaxMin.value) }}
There you go! You have now applied the range of colors to the columns.
BONUS: Allow users to dynamically select the color
- Add a Color picker component
- Add another transformer (I called it rgbToH) and write the following code which will change from RGB to Hue
    const rgba = {{  colorInput1.value}}; // Example color
    const rgbaArray = rgba.match(/\d+/g); // Extracts all numbers from the rgba string
    const r = parseInt(rgbaArray[0]);
    const g = parseInt(rgbaArray[1]);
    const b = parseInt(rgbaArray[2]);

    // Normalize RGB values to the range 0-1
    const rNorm = r / 255;
    const gNorm = g / 255;
    const bNorm = b / 255;

    // Calculate max, min, and delta
    const max = Math.max(rNorm, gNorm, bNorm);
    const min = Math.min(rNorm, gNorm, bNorm);
    const delta = max - min;

    // Calculate Hue (H)
    let h = 0;
    if (delta !== 0) {
        if (max === rNorm) {
            h = (gNorm - bNorm) / delta;
        } else if (max === gNorm) {
            h = 2 + (bNorm - rNorm) / delta;
        } else {
            h = 4 + (rNorm - gNorm) / delta;
        }
    }

    h = (h * 60) % 360;
    if (h < 0) h += 360;

    // Return the Hue value
    return h;
Within your function, add another parameter, call it color, and update the function as follows:
if (amount === 0) return "";

  // Retrieve min and max values for the specified month from the provided heatmapData
  const min = heatmapData[`min_${month}`];
  const max = heatmapData[`max_${month}`];

  // If amount matches the min or max, return predefined colors
  if (amount === min) return `hsl(${color}, 56%, 84%)`;
  if (amount === max) return `hsl(${color}, 20%, 60%)`;

  // Calculate interpolated hue and lightness values
  const hue = 56 - ((amount - min) / (max - min)) * (56 - 20); // Interpolate hue
  const lightness = 84 - ((amount - min) / (max - min)) * (84 - 60); // Interpolate lightness

  // Return the generated HSL color
  return `hsl(${color}, ${hue}%, ${lightness}%)`;
Finally, the functoin in the columns also needs updating to
{{ getColor(item,"Jan", getPaymentsMaxMin.value, rgbToH.value) }}
If you need any help with this do let me know!
Heatmap Table (2).json (51.1 KB)


