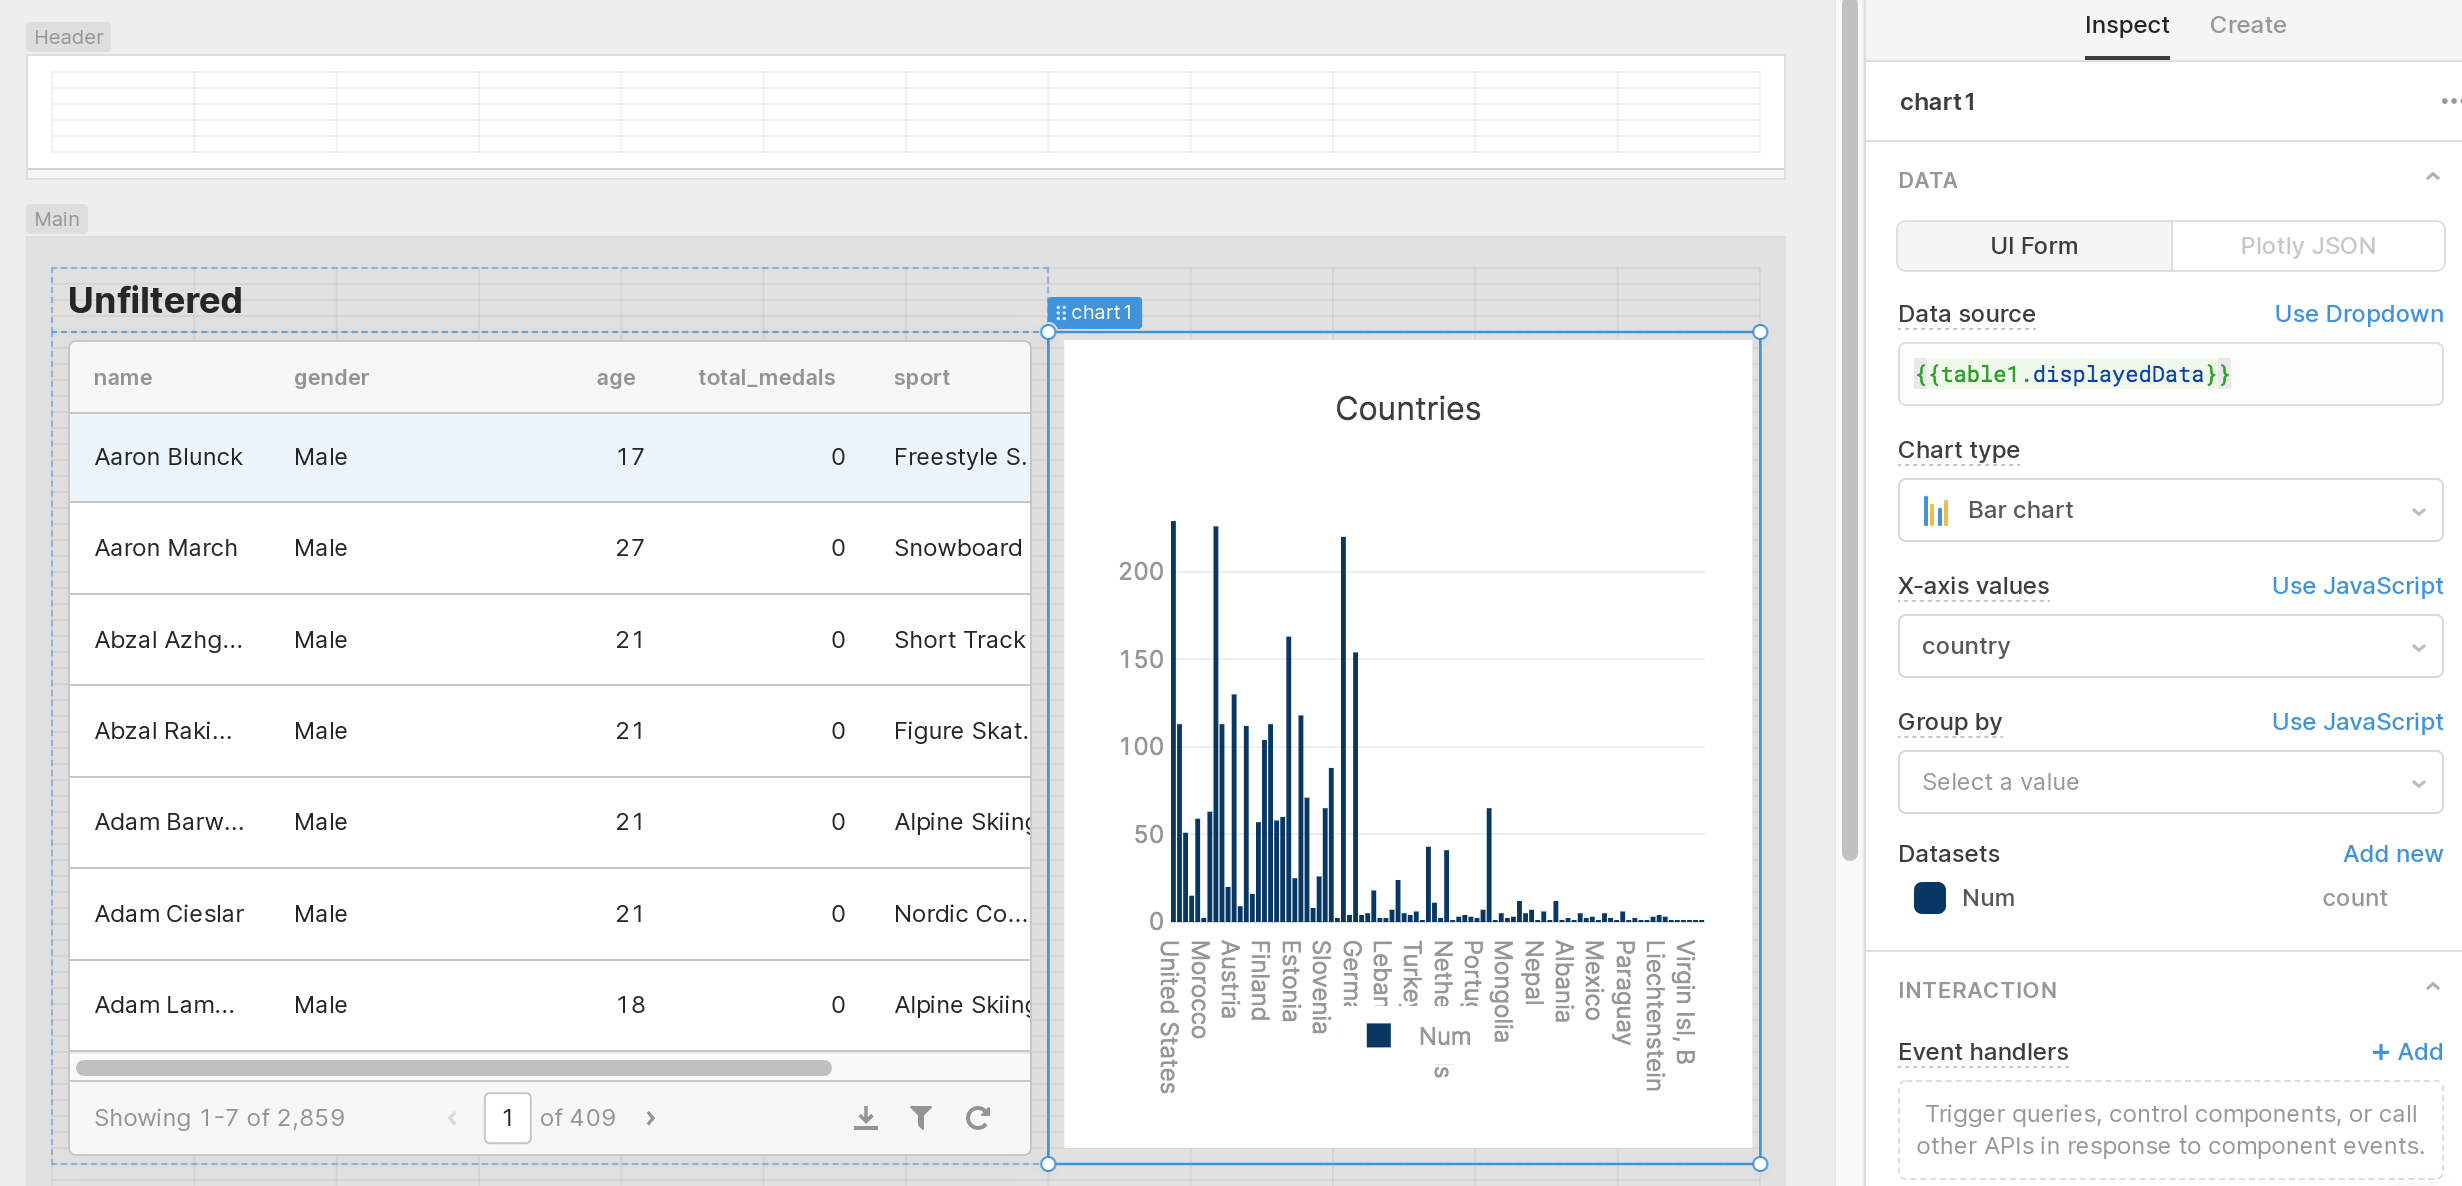
I have an array of users , and an array of items, I have used the aggregation function sum to aggregate the total number of items for each user. But I am unable to sort the graph generated. How to do it?
Hey @Slimshadynick! For some context here are you working with the Chart component (that uses plotly.js)? How would you like to sort your graph?
Hi @Kabirdas
I have the same issue.
I have a bar chart that uses a table as source and aggregates by a prop and sum the occourrences. I'd like to sort the bars in descending mode based on the computed value of the aggregation.
The JSON source of the chart contains already a transform 'sort' but it doesn't work properly because is using a wrong value:
"target": {{formatDataAsObject(table1.displayedData)['country']}}
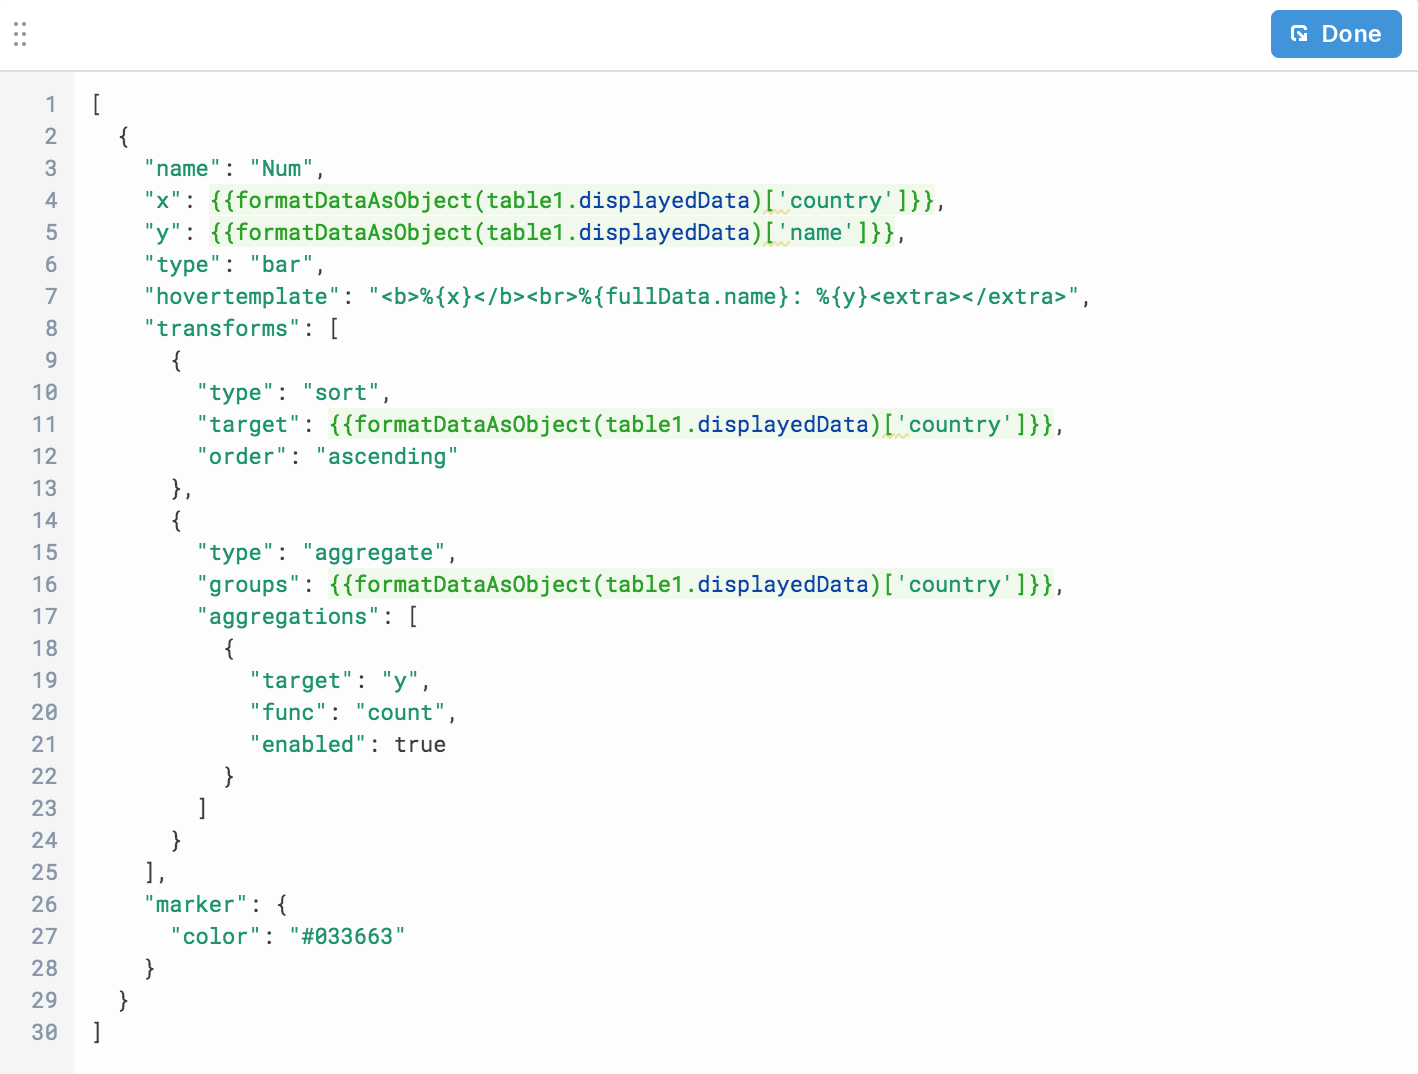
I really don't know how to set the computed value in Plotly.
Alerady checked in the Plotly whole doc and they don't mention this possibility.
Possible work-around would be to use a data transformation in js to make the sort.
What do you think?
Many thanks.
Fabio
Hi @abusedmedia, yes! You can always transform your data with JavaScript. Performing the sort this way can assure you that your data is always sorted before displaying into the chart.
Taking a closer look at your data, it looks like {{ formatDataAsObject(table1.displayedData)['country'] }} may not evaluate to a numerical value which can make it difficult for Plotly to sort. Are you able to change the 'target' to a different array with a numerical value?
Hi @Kenny
Yes, I've solved using a transform specific for the chart.
Just wondering if it was a good practice or not in Retool env.
Thanks