Hi Retool community!
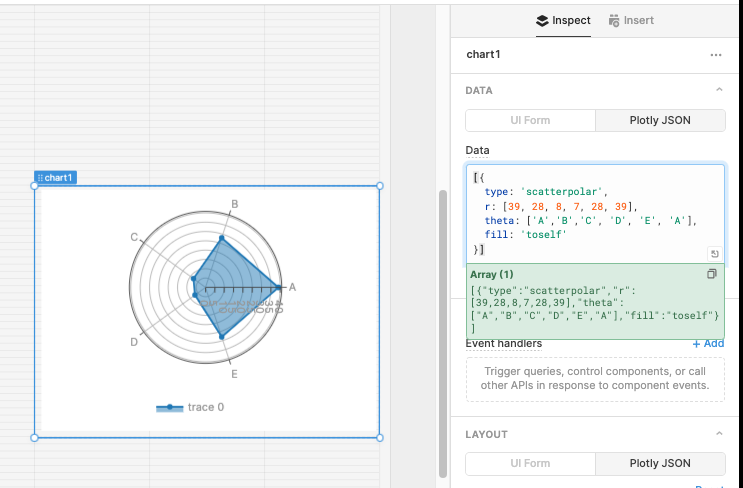
Reading the docs (https://docs.retool.com/docs/plotly-charts-beta) it seems like I should be able to build any chart that is available of plotly inside retool by using the 'data' and 'layout' sections of a chart. I'm trying to build a radar chart (Radar charts in JavaScript) but the chart still looks like a regular bar chart. This is my 'data':
{
  type: 'scatterpolar',
  r: [39, 28, 8, 7, 28, 39],
  theta: ['A','B','C', 'D', 'E', 'A'],
  fill: 'toself'
}
And this is my 'layout':
{
polar: {
radialaxis: {
visible: true,
range: [0, 50]
}
},
showlegend: false
}
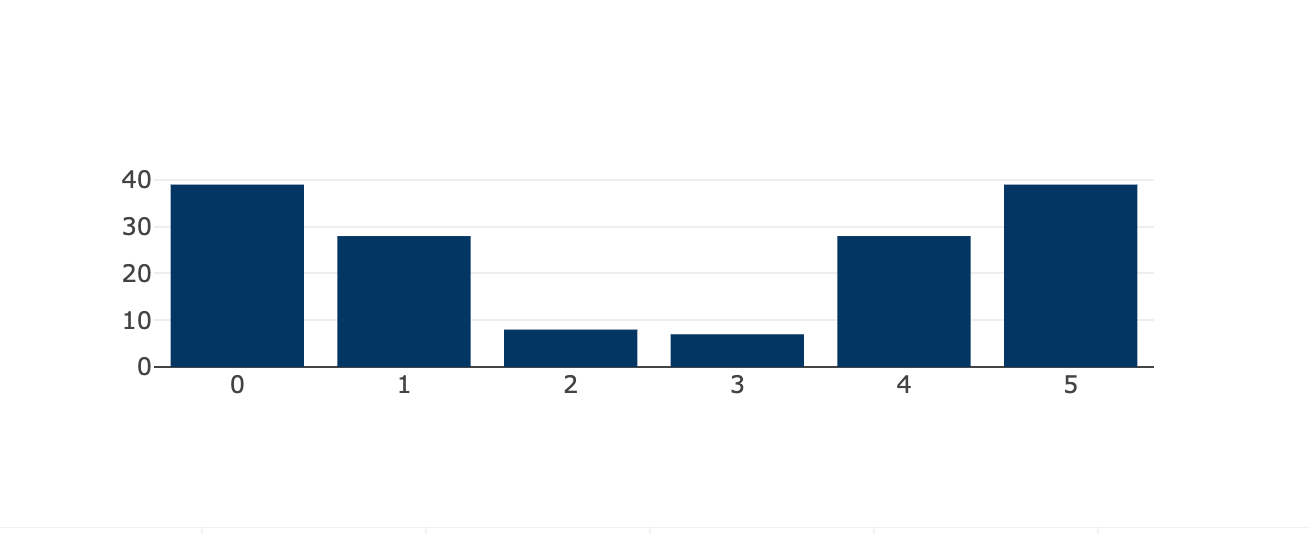
(Basically a copy paste from the plotly docs example.) The output is:
Many thanks,
Fina