I want to make funnel shapped chart through Js. How can I do this in retool
I read that,but I am not able to map this code in retool.
I have never used plotly before so I am afraid I cannot be of any help to you....
It's very delayed to be answered.
Hi there @ishi8 ![]()
Sorry for the delayed response there. I'm afraid I myself have very little experience using plotly but will check-in with the team to see whose more familiar with that. Hopefully they'll be able to lend another pair of eyes on this.
Best
Pawan
@ishi8, have you tried to load some of those examples in the docs you'd referenced in your original post. Try using our Chart Component to do this. Here's an example of a funnel chart in Retool I was able to find:
[
  {
    "type": "funnel",
    "name": "Montreal",
    "y": [
      "Website visit",
      "Downloads",
      "Potential customers",
      "Requested price",
      "invoice sent",
      "closed deals"
    ],
    "x": [
      120,
      60,
      30,
      20,
      5,
      1
    ],
    "textinfo": "value+percent initial",
    "hoverinfo": "none"
  },
  {
    "type": "funnel",
    "name": "Toronto",
    "y": [
      "Website visit",
      "Downloads",
      "Potential customers",
      "Requested price",
      "invoice sent",
      "closed deals"
    ],
    "x": [
      100,
      60,
      40,
      30,
      20,
      4
    ],
    "textposition": "inside",
    "textinfo": "value+percent previous",
    "hoverinfo": "none"
  },
  {
    "type": "funnel",
    "name": "Vancouver",
    "y": [
      "Website visit",
      "Downloads",
      "Potential customers",
      "Requested price",
      "invoice sent",
      "closed deals"
    ],
    "x": [
      90,
      70,
      50,
      30,
      10,
      8
    ],
    "textposition": "outside",
    "textinfo": "value+percent total",
    "hoverinfo": "none"
  }
]
Hi @ishi8 ![]()
That example was meant for demonstration purposes and was taken from within someone else's app on the team. It may not work outside their app since it may depend on information coming from their db/resource but regardless I was hoping to demonstrate what it would typically look like.
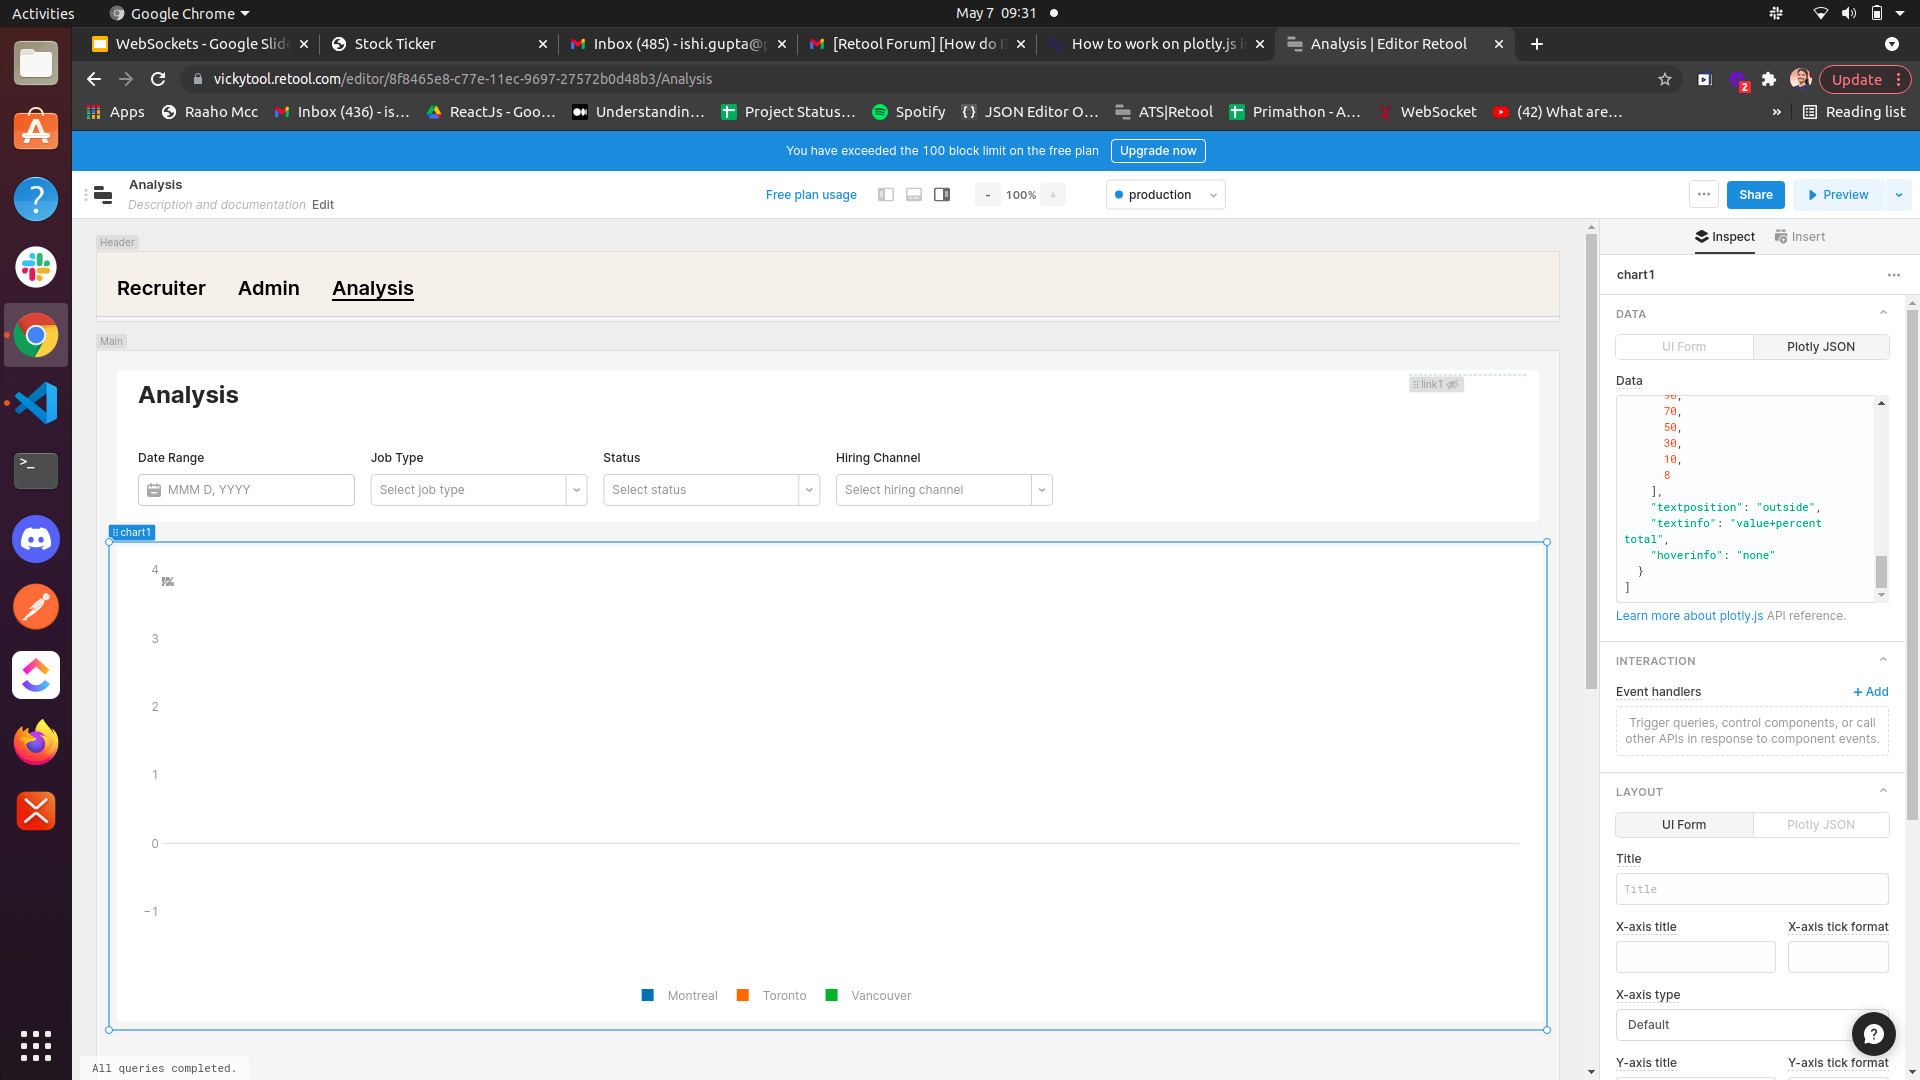
Can you try once as funnel is not working in retoool
@ishi8
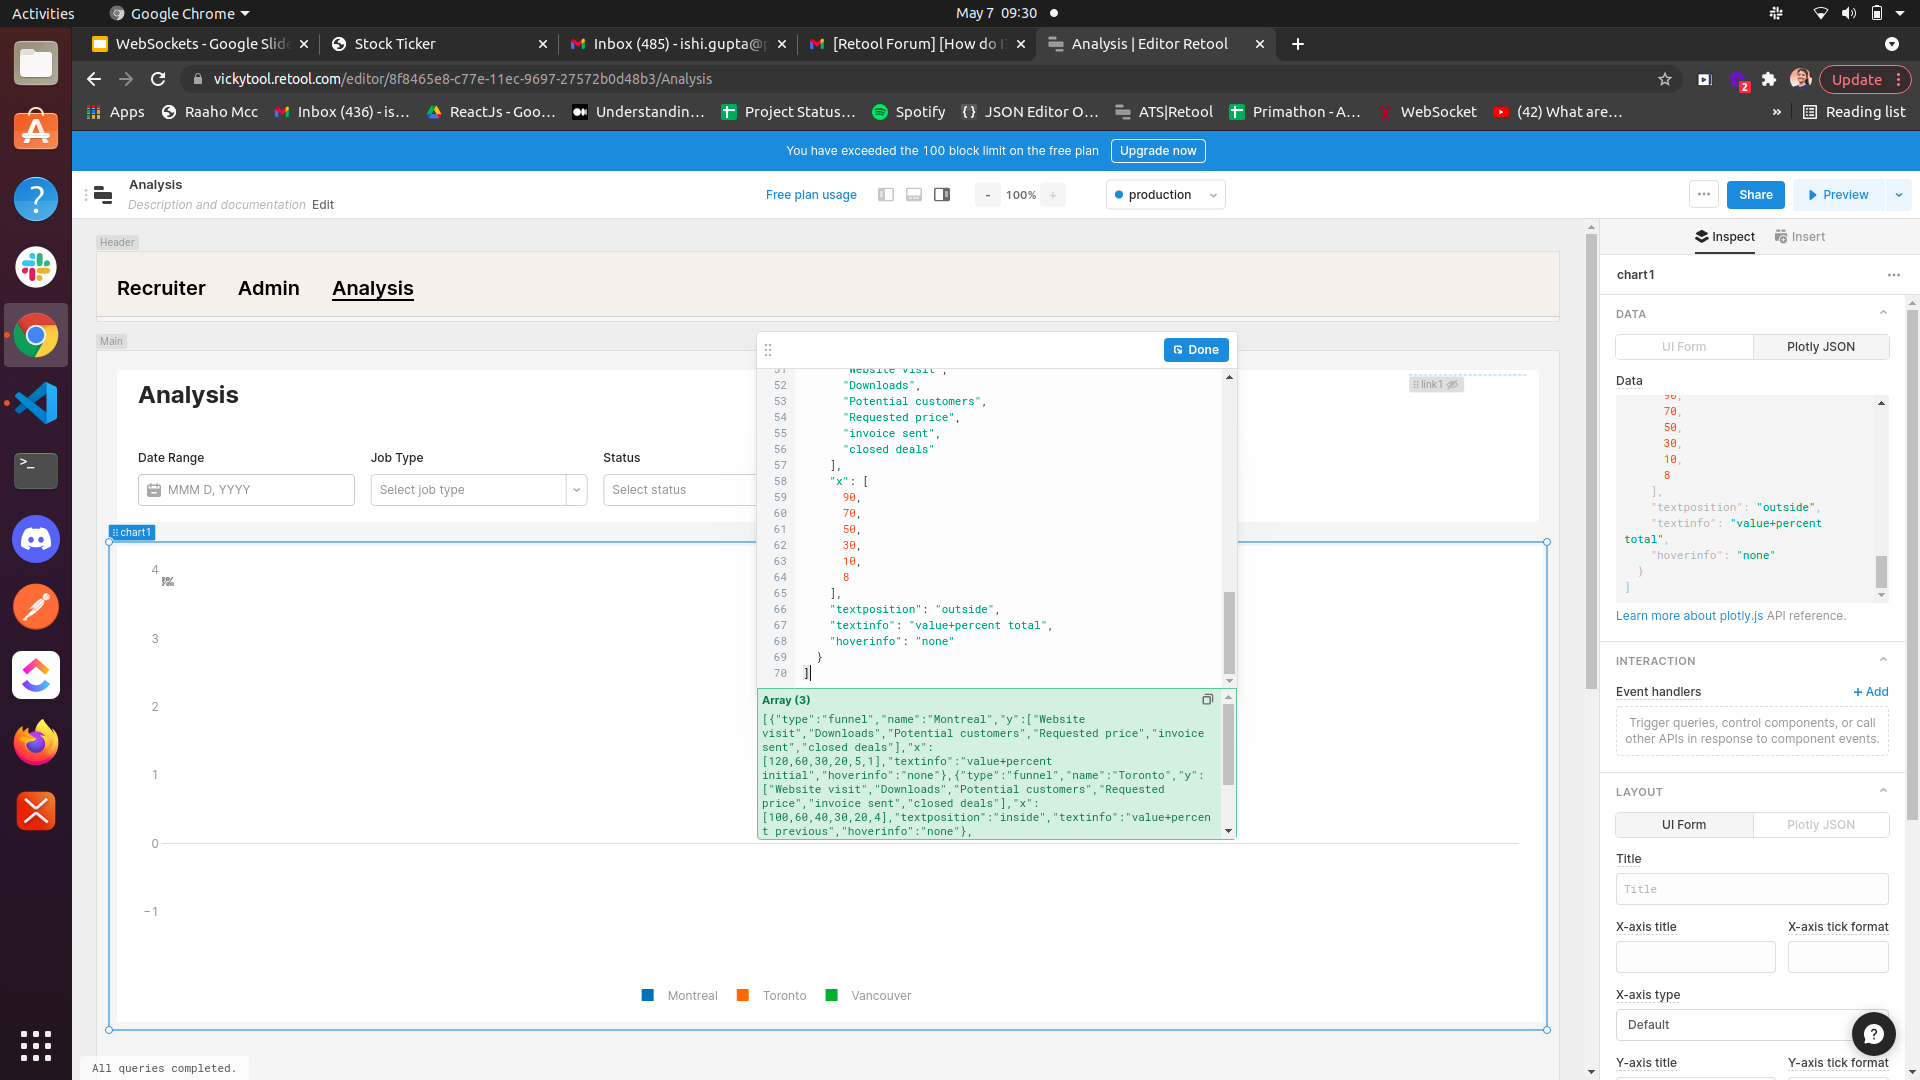
I was able to view a funnel when inserting the code above in the data section and then also in the layout field as noted in screenshot below
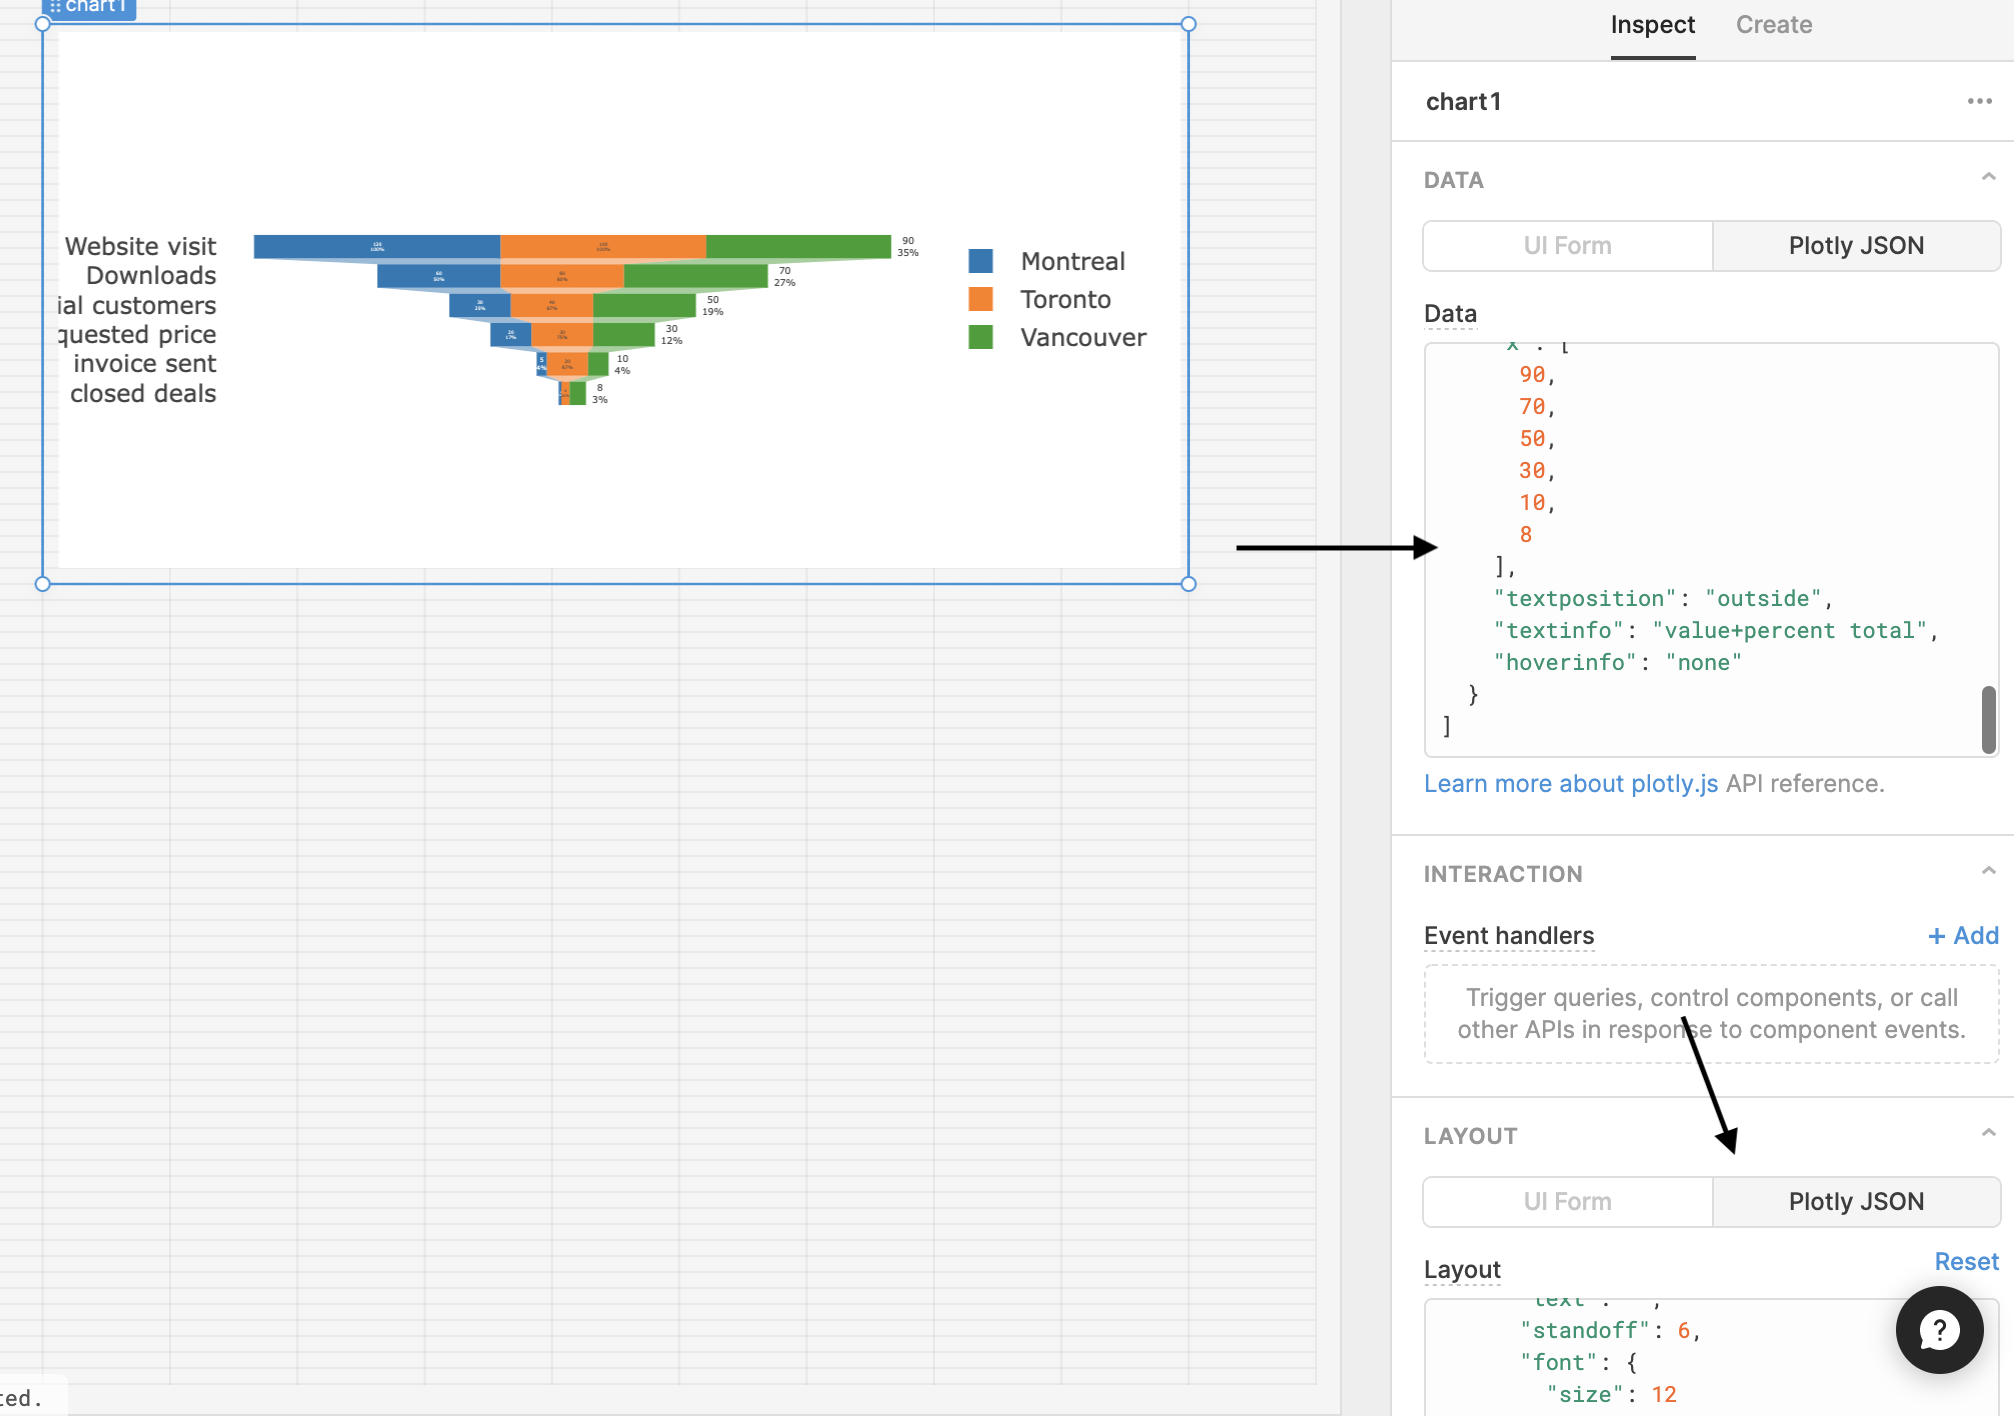
@ScottR
[
{
"type": "funnel",
"name": "Montreal",
"y": [
"Website visit",
"Downloads",
"Potential customers",
"Requested price",
"invoice sent",
"closed deals"
],
"x": [
120,
60,
30,
20,
5,
1
],
"textinfo": "value+percent initial",
"hoverinfo": "none"
},
{
"type": "funnel",
"name": "Toronto",
"y": [
"Website visit",
"Downloads",
"Potential customers",
"Requested price",
"invoice sent",
"closed deals"
],
"x": [
100,
60,
40,
30,
20,
4
],
"textposition": "inside",
"textinfo": "value+percent previous",
"hoverinfo": "none"
},
{
"type": "funnel",
"name": "Vancouver",
"y": [
"Website visit",
"Downloads",
"Potential customers",
"Requested price",
"invoice sent",
"closed deals"
],
"x": [
90,
70,
50,
30,
10,
8
],
"textposition": "outside",
"textinfo": "value+percent total",
"hoverinfo": "none"
}
]
{
"title": {
"text": "",
"font": {
"color": "#3D3D3D",
"size": 16
}
},
"font": {
"family": "Inter",
"color": "#979797"
},
"showlegend": true,
"legend": {
"xanchor": "center",
"x": 0.45,
"y": -0.2,
"orientation": "h"
},
"margin": {
"l": 16,
"r": 24,
"t": 24,
"b": 32,
"pad": 2
},
"hovermode": "closest",
"hoverlabel": {
"bgcolor": "#000",
"bordercolor": "#000",
"font": {
"color": "#fff",
"family": "Inter",
"size": 12
}
},
"clickmode": "select+event",
"dragmode": "select",
"xaxis": {
"title": {
"text": "",
"standoff": 6,
"font": {
"size": 12
}
},
"type": "-",
"tickformat": "",
"automargin": true,
"fixedrange": true,
"gridcolor": "#fff",
"zerolinecolor": "#fff"
},
"yaxis": {
"title": {
"text": "",
"standoff": 6,
"font": {
"size": 12
}
},
"type": "linear",
"tickformat": "",
"automargin": true,
"fixedrange": true,
"zerolinecolor": "#DEDEDE"
}
}
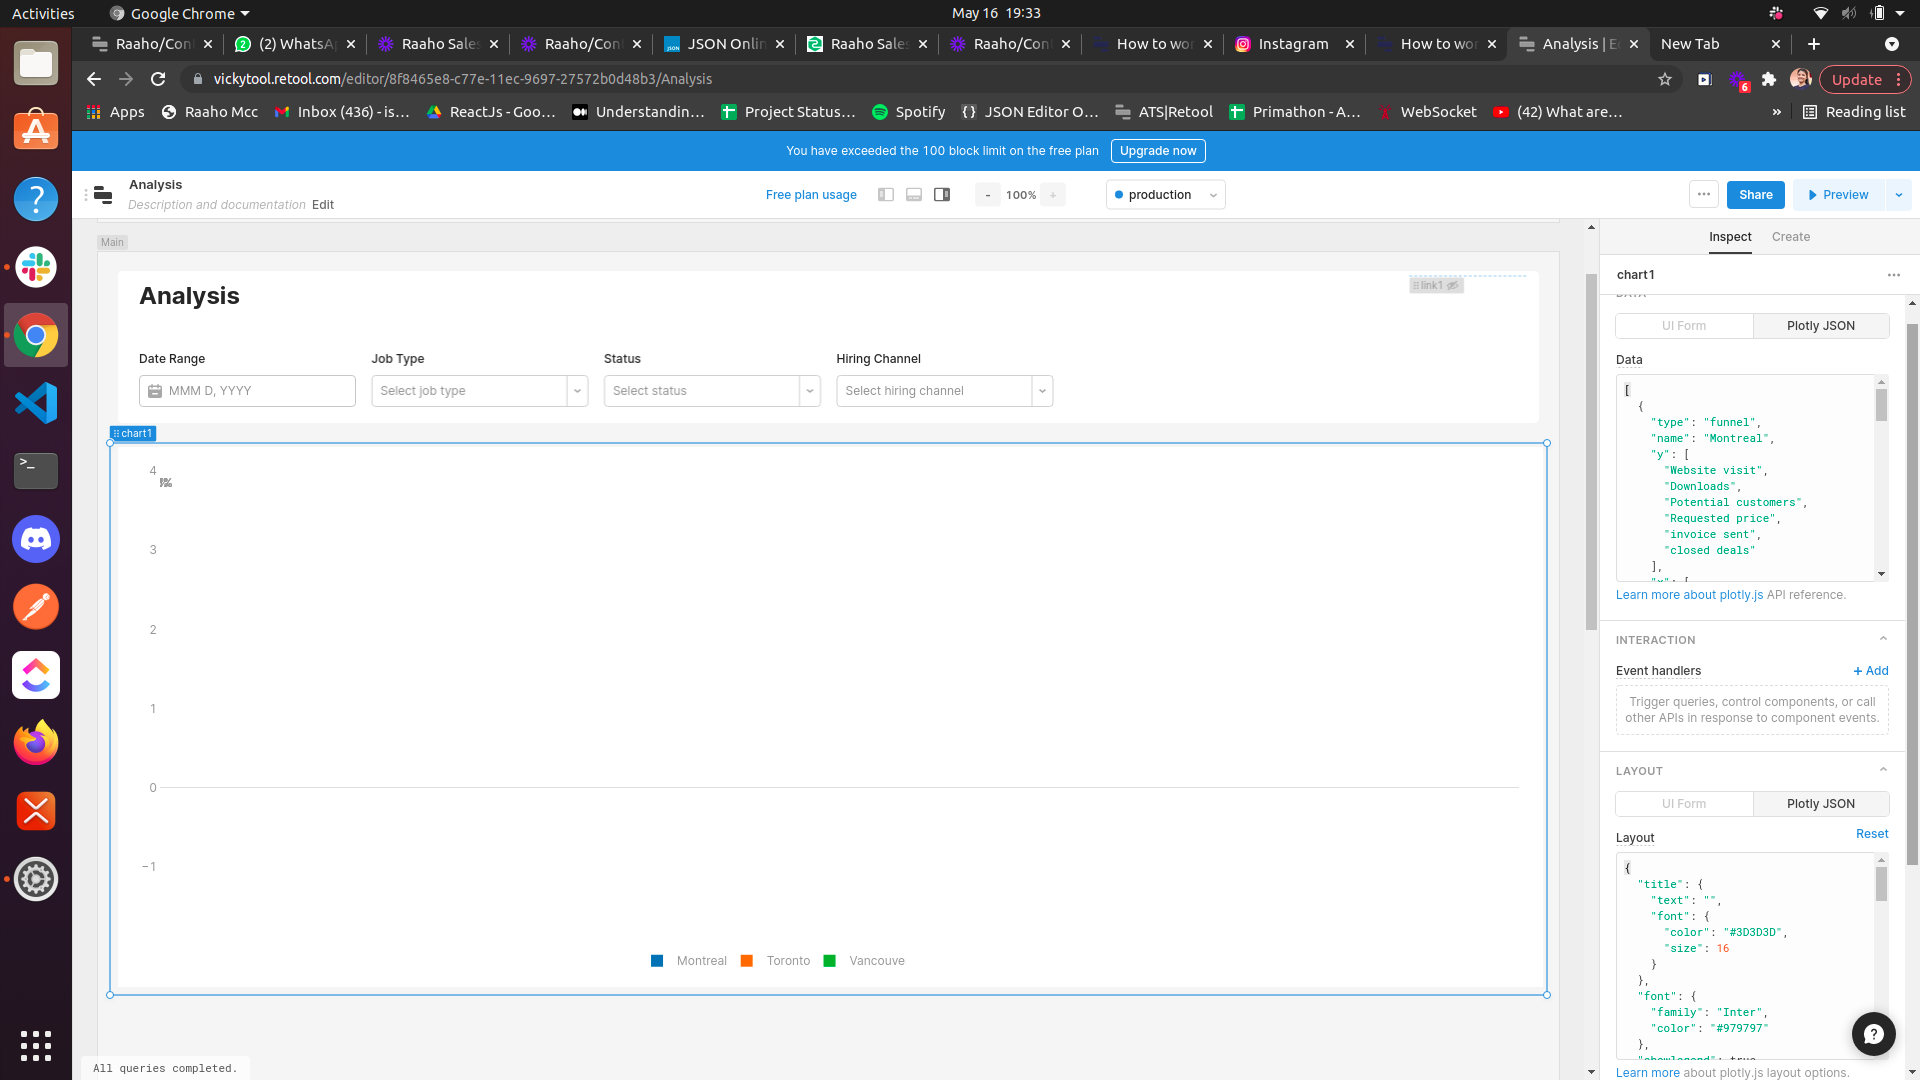
Looking at your screenshot, I see that there is a notification that you have exceeded your 100 block unit... not sure what that means.... but it could be that you're running the free version and perhaps there is a limit as to how many components you can use? Maybe @Pawan knows more...
I think there is a limit you exceeded.... can you click on where it says Free Plan Usage?