It would be great to be able to set the heatmap style of colouring for a chosen column in the table component, like cells with lowest values have red background and cells with highest values have green background. This is very similar to conditional cell formatting with color ramp in Excel or Sheets.
I assume this can be done via implementing a custom color mapper but it's too complicated for a one-liner that it is now, and it has to dynamically use the current values of the table column, so can't be hardcoded once.
Hey Bastien & AlexYes — I definitely agree that native support of this would be very helpful! I've created an internal feature request and linked it to this thread so we can update this thread as we look into this. In the meantime, one option here could be to create an object and then use {{self}} to key into that option like this, or if the heatmap would require more logic, you could create a pre-loaded JS function that could take in the value and return a color like in this thread. Do you think this could work for your use case?
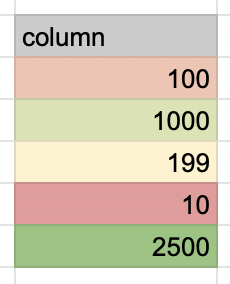
This can be done by using the Background field in the column: {{ self >= 100 && self <= 200 ? 'yellow' : '' || self == 100 ? 'orange' : '' || ... and so on}}
All depends on the range you need to account for in each ternary condition...