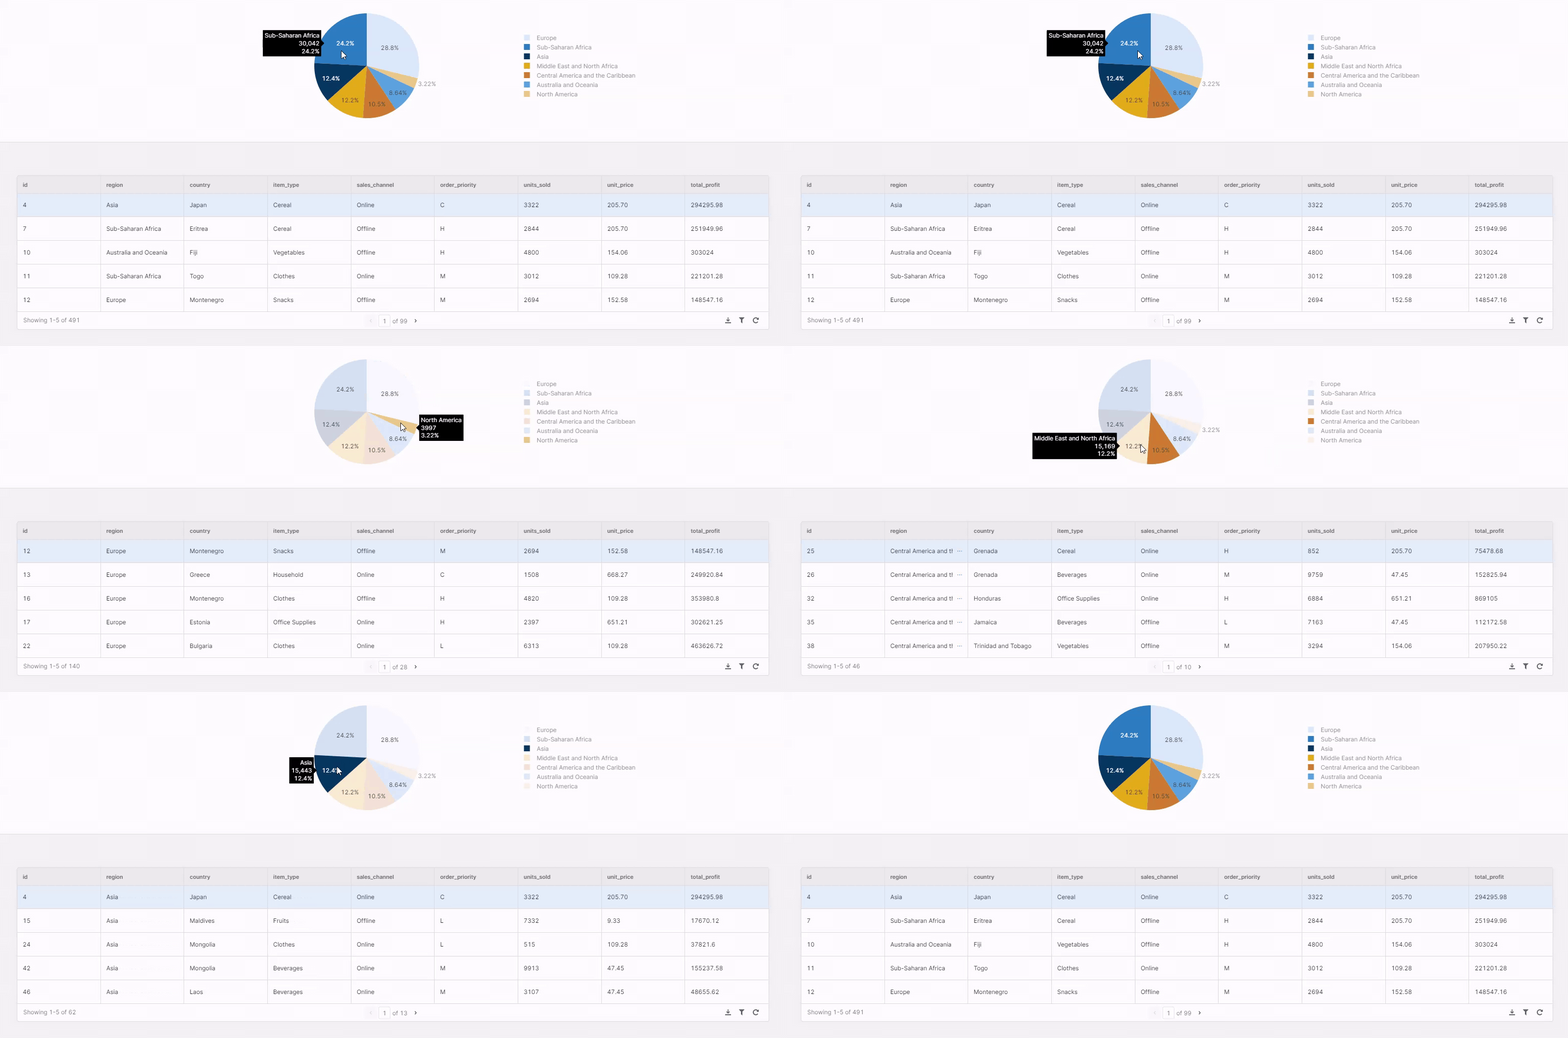
One of my favorite little Retool hacks is filtering tables using different plotly charts.

To do this, you just need to make use of Retool's Query JSON with SQL feature:
select * from {{query1.data}}
where ({{_.isEmpty(chart1.selectedPoints)}} or region = ANY({{chart1.selectedPoints.map(d=>d.label)}}))
Set your table's data input field equal to the query above, and when a user selects a point in the chart it will filter the table according to the selected point in the chart ![]()

