My goal: receive data from cached queries in a few seconds
Issue: cached queries are taking up to 10 seconds to load
Steps I've taken to troubleshoot: refresh
Additional info: cloud hosted
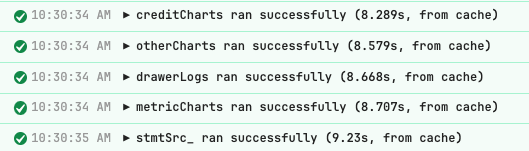
Cached queries that a few days ago loaded more or less instantly are now taking 8-9 seconds to load. These are not large queries -- most are less than 1 KB of data. And yet...
Hi @jericsinger, is this an ongoing problem? If not this could have been due to a latency spike, but there are many factors that could affect the run time of a query, even a cached one. Do these queries now depend on the result of another query?
We aren't seeing any breakages or slowdowns on cloud on our end.
Have you tried running this app on a computer with different hardware? One way I was able to replicate slow cached queries on my end was by creating an extremely inefficient transformer (triple nested forEach loop) tied to the query, which slowed down my computer and created artificially high query times.
Can you check your activity monitor / task manager and see if high CPU usage is the culprit? If that is the case you'll want to look into what you've added in the last week or two that may be slowing your app down, or potentially any separate programs that could be hogging the CPU usage.
High CPU usage has been a massive ongoing problem for me in both mobile and desktop app development (see Mobile App Builder freezes when deleting components). I've gone through every page of my app and removed zombie components, converted large transformers to queries, and removed all list components (which in practice function as unquenchable compute vampires), and though those changes massively improved editor performance, I'm still dealing with sporadic high CPU usage that brings the editor to a halt.
And yes, this happens on both my at-home and in-office hardware, both of which are Macbook Pros of 2023 vintage or newer.
Glad to hear you were able to track down at least some of the issues with CPU performance. You mentioned earlier that your queries previously loaded more or less instantly, so I'm just curious if there was potentially something else added in that time which slowed things down.
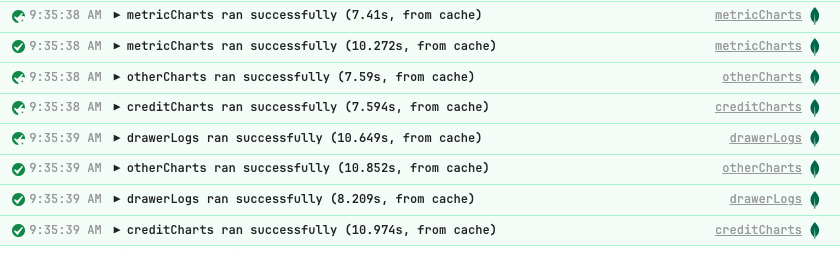
One thing that I can see from your screenshot is that you have 8 queries running in the span of about 1-2 seconds, and each query is running more than once in that time. Is it possible you have an N+1 query somewhere? For example, looping over an array of data and making a query for each item in the array. Something like that could definitely be the cause of the slowdown.
In case you haven't seen it already, here is our page on query best practices. If you want to share any code here to get another opinion on I'd be happy to take a look too.
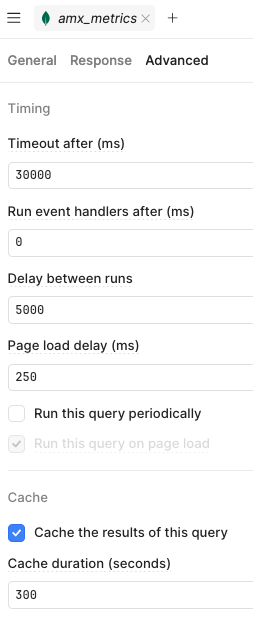
In that instance, I double-clicked the page-load tab and it ran the onLoad resources twice. I've since updated the resource settings to prevent double-runs using the settings below:
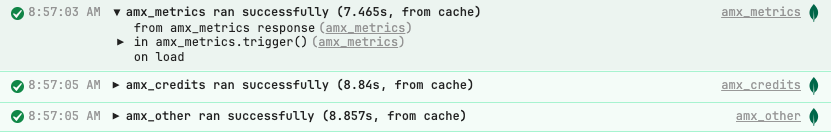
However, the problem persists. These are queries that, again, run automatically on page load. They return ~500KB each, so not large. When they run uncached, it takes 2-3 seconds. When they run cached, it's 7-10 seconds, still.
Ok, I still think it's likely a CPU usage issue, just somewhere else in the app.
Is this a problem on all apps? Or just this one? Does closing all other browser tabs help? How high is the CPU usage of your Retool tab specifically?
Something else you can do is go back in version history to your app before it started running slowly, and make note of whats been added since then. You could then go back to the current version and do a process of elimination to see if there is a noticeable difference when removing certain components/queries/logic.
Reverting to an older version would be an option if this happened yesterday or after a change, but that's not what happened here. The editor started hanging up a year ago (as documented in the forum), and changes help or hurt somewhat randomly. This is a core app for our business, so rebuilding and adding/removing one component at a time to find the memory leak is not a practical suggestion. There's a memory leak somewhere in the app and I'd be glad to give you guys a JSON export to do some analysis, but if you ask me to come to office hours again (which directly conflict with my internal meetings), I'm going to scream.
I'd be happy to check out your app json, feel free to DM it to me. I had suggested the revert only because you mentioned that the queries ran quickly about 2 weeks ago, but I understand some of this has been ongoing for some time.
Hey I just saw another thread of someone complaining of performance issues, and it seems to have been solved by closing the Graph pane. Do you want to try that out? Also I have been looking at your app and I have some thoughts about potential improvements in performance but I’ll follow up in our DMs about that, just thought I should let you know about this.