- My goal: Find out why our apps seem to be using a lot of memory
- Issue: After editing an app for awhile, I often see my browser tab over 3 gb of memory usage and the app is very sluggish. Especially when deleting an item. I often have to wait 30 or more seconds when simply deleting a event from a component.
- Steps I've taken to troubleshoot: Examined my setups but I do not feel they are really that large. Often just a table with some inputs for submitting filtering to database queries.
- Additional info: I am running on cloud. I putting this question out there because I really feel like it is worst over the past few months.
I’ve faced this issue too and here’s what I do to manage it: Retool cloud apps can consume high memory due to large datasets, frequent or auto-running queries, and many components or states. The editor builds up memory over time, leading to sluggish performance. I make sure to run only the necessary queries and delete unused ones. I avoid storing large data in temporary state, break big apps into modules, and refresh the browser regularly. Chrome DevTools helps track memory usage and spot issues early.
The best solutions I found to avoid this are:
- Only fetch the DB columns/fields you need.
- Try to avoid unnecessary dependencies (such as hidden table rows)
- Try to store query results inside a Variable and THEN Reset ( query.rest() ) that query to clear its output, result, and the .rawData. These data are always in memory.
- Generally, try to avoid unnecessary dependencies everywhere (this means, don't use references that you don't need at the moment OR try to group multiple references into a single Transformer so the number of cross dependencies is low.
- Use pagination when possible, even if you already fetched 1000 rows, try to only display 100 per page => results in fewer HTML elements & dependencies.
These are some general advice, you might need case-specific solutions.
Thanks for the feedback. What I usually do is fetch results, then store the processed results as an object of objects(row id as key) and I store just an array of ids also in a variable. Then I use a transformer to build an array linking the array of ids to matching items in the object of objects. When a user edits an item, the item is saved to the db and when successful, I just update the values in the object of objects instead of refreshing the complete db query. I have been trying to keep a lot of dynamic processing happening in the table itself like linking thumbnail ids up with there matching data that was also called into and stored in a variable. Is the general thought that possibly performance could be better by linking up all data that I would do in the table such as the thumbnails, inside the transformer instead? The reason I have it being doing it in the table is because my thinking was it would be less processing. If doing in the transformer, every time a new image gets stored into the variable, the transformer has to render again.
I still think there is something abnormal going on with the environment. For example, I have made a little module. The module contains x5 code items and x5 components. When I create a new browser tab and open up the module in edit mode, the module is immediately consuming close to 1gb of memory. This feels really high for basically nothing in the module. It sort of feels more like a module thing. I did have two drawer modals in this module with a table and a few basic inputs but I had to remove them. The module would frequently be running over 3gb of memory and the module was noticeably impacting the performance of apps it was being used in.
I've noticed this as well - did you ever come to some sort of resolution on this?
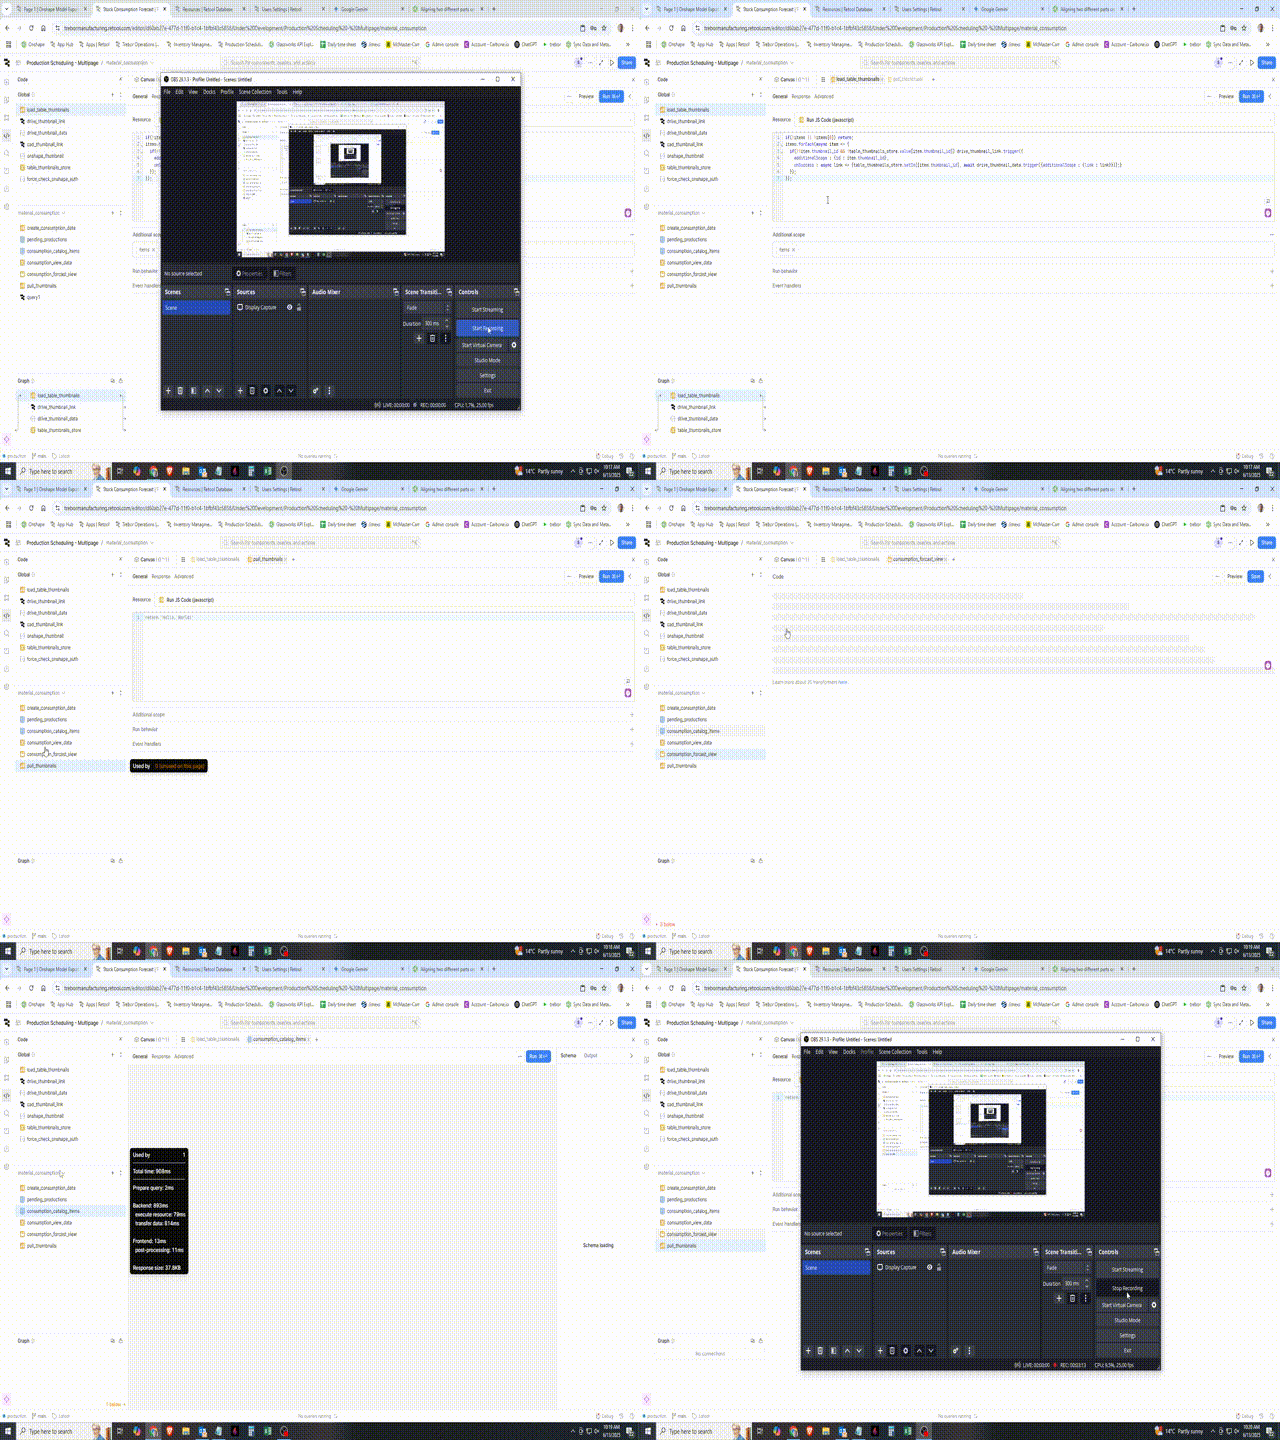
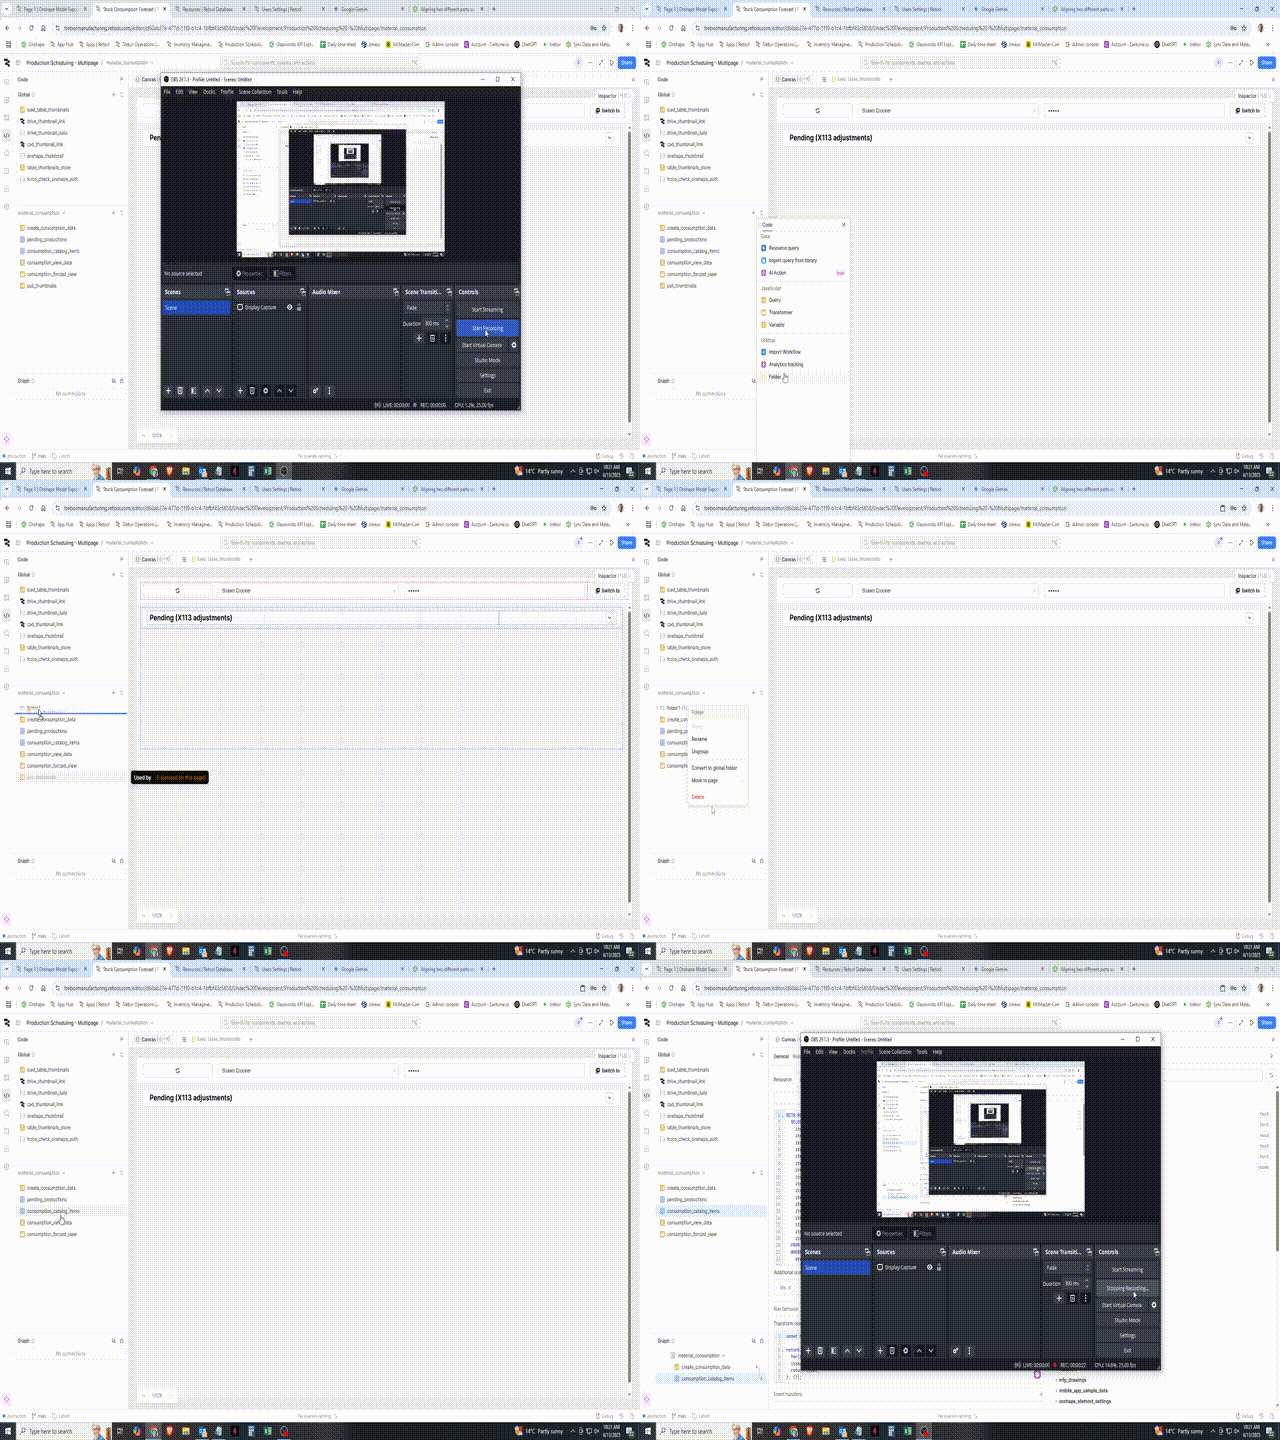
I didn't. I still experience what I believe is abnormally bad performance. The apps I work on now are really not any different from the apps I have worked on maybe a year ago. Even really small apps or module will usually cause my web browser to think the page has stopped responding when I try to delete something a simple as an event handler on a text input. Something new I noticed is, if I deleted a folder with queries in it, they all delete really fast.
This what I experience most time I want to delete something. It almost feels like the backend is completely rebuilding the entire underlying JavaScript.

And here, I put a query I want to delete into a folder and it just gets delete right off with no hassle. I think it is because when deleting a folder, retool does not check the item in the folder for where it is being referenced.

It would be neat to get a bit of feedback from the retool team on this.
Hi @Shawn_Crocker, that is a very interesting issue you're having, and I would agree that this seems abnormal. Our team has done some research on modules recently, specifically to investigate potential performance issues. The conclusion was that, on average, there was no significant difference between functionally similar apps using modules vs not using modules (as well as nested modules). This was tested across a large variance of app complexity. Some things to note:
- Each module input adds to the module complexity, and so then limiting the number of module inputs would reduce the complexity, and improve performance.
- Avoid using a large number of hidden modules. All components, queries, inputs, etc in a module will contribute to the overall performance whether or not they are hidden or visible.
- It's ok to nest modules. It's better to nest modules than to create one big module that you only use a small fraction of (as to the previous point).
As to your issue with editor performance and specifically the difference between deleting a query vs deleting a folder with the query, we haven't seen that before. If you DM me a JSON of your app, or something similar where you're having this issue, then I can repro this and get a bug report in and investigate further.
@Mike_M Thanks. I will send you a JSON export of the module I am noticing this high memory usage in. I am wondering if simply recreating the module might reset something internally in it? Possibly it was created at a time before some sort of performance fix was made and it is stuck running some legacy stuff under the hood?
So I have noticed that your module is using over 1GB of memory on chrome, but I'm not experiencing any editor performance issues, nor am I able to reproduce that particular problem with deleting a query, although I also don't have the same dataset as you.
I am wondering, are you having performance issues across all your apps? Or just the ones using this module? If you check your task manager, are you close to the limit on RAM?
If it's specific to this module, I do think you could make it more performant, although it would require refactoring. The number of module outputs is quite high, and I believe you could just output all the data as one output. On the other hand, I also question if this module needs to perform an extensive query, when it seems your input fields are really only reliant on user_settings. A smaller query is likely to improve performance.
Lastly, we are hosting office hours tomorrow, from 2-3 pm EDT. Feel free to stop by and we could help you out in real time.
Hi @jg80, I know this was a few days ago but if you are having similar issues I'd be curious to see as well. If you DM me a JSON example of what you're experiencing, it would help me repro this in case there's a more common problem we aren't aware of.
Thanks for looking. Is 1gb normal for something so small? 1gb seems huge to me for what is in that module. Most of our apps have this module loaded in. It's main purpose it to feed a small quantity of standard content into the apps. Things like catalogue and category settings so the apps can key into these libraries to populate select components and things. I will restructure the module to feed everything through a single output. I have 32 g of computer ram and the PC is usually pretty far away from that usage. The issue with deleting anything in the app taking a really long time seems to be present in most apps. I have a sneaky suspicion it's some UI components like drawers or listview. I have some apps with alot of queries and code which I use to do some quick a dirty bulk tasks. They have minimal UI components and I don't see the same massive hangup when deleting something. They were also created after multipage apps were standard so I keep wondering if there is some legacy flaw in apps created before a certain date. Most of our apps have a noticeable hang as they load in. Our apps do initiate an ably connection when starting up to have realtime syncing so, possibly it's just hanging. I think I will need to copy out a problem app and then strip out on object at a time to see if I can find the culprit.
Sorry - but I can't share the JSON for this application. We do know that we are bringing fairly large objects into the application, so we expect some overhead - the weird thing for us was that the editor just keep growing, while the "view" was more in line with expectations.
@Shawn_Crocker 1 GB does seem like a lot for something small, but there seems to be other factors for that number. I created the module on two different accounts and noticed that on another account it was only around 400 MB. Regardless, since I haven't experienced the same IDE performance slow downs I'm more inclined to say that that isn't the problem (especially considering I do get close to maxing out my RAM usage with the amount of tabs I have open).
I think it is a great idea to systematically test what might be creating this performance issue. You could also go the other direction, where you take an app that's performant and try adding components or queries that you suspect might be slowing your apps down.
Hi @jg80, no worries if you can't share the JSON. How big of a dataset are you bringing in? If it's something that could potentially be paginated, that is likely to improve your performance.
I think the consistent thing that affects performance when deleting stuff is having a query preview flyout open when doing a delete. I have noticed the entire app slow to a crawl when even a very small amount a data is being displayed here. To correct the overall performance of our main apps, I am breaking them down into multipage apps. It a bit time consuming linking everything back up but, I am noticing much better responsive behavior with less model frames being replaced with app pages that open in a new tab. I actually like the multipage layout and how it naturally encourages tighter organization of components and queries.
Are you on windows 11? I wonder if this could be the culprit.
Either way, yes we definitely encourage using multipage apps to improve performance.
No, I'm on windows 10 in both office and home computers. Both have similar specs. Old 2013 i7 3.7 GHz processor, 32gig ram.