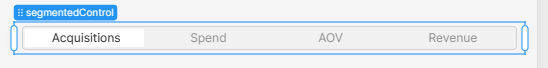
Here's my current issue that I haven't been able to google my way out of. I want the aggregation in the graphs (which column to use) to be controlled by the button shown above the graph. On the left, the graph would be displaying a bar graph with values for each of the channels (the values in the table are already aggregated) and on the right, the values would be shown as a time series (day, value) for that channel. (The right table is populated based on which line of data is selected in the left. I'm having trouble figuring out where/how to define the y-variable in the graph based on the value of the button! Any help is greatly appreciated - I've been stuck on this for quite some time!

Hey Danielle,
If you click on the "Plotly JSON" you will be able to see the code that is used as data for the charts.
Then you can proceed to find values for data/labels of "y" column and dynamically set them based on your checkbox.
Hope this helps!
Yes, tried that approach but haven't been able to determine how to edit this appropriately. In the y axis I need the column (currently acquisitions) to be controlled by the button but haven't been able to figure out how to replace that. Ideas?

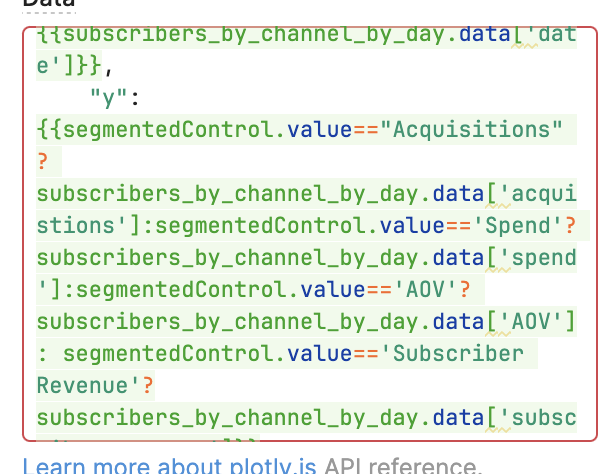
To chime back in here an example for "y" would be:
...
"y":{{segmentedControl.value=='Acquisitions'? subscribers_by_channel_by_day.data['acquistions']:segmentedControl.value=='Spend'? subscribers_by_channel_by_day.data['spend']:segmentedControl.value=='AOV'? subscribers_by_channel_by_day.data['aov']: subscribers_by_channel_by_day.data['revenue']}},
...
Does this work?
Thank you for the response - I think I'm close, but something about that syntax makes Plotly unhappy! I've tried changing number of "=" as well as asking ChatGPT ![]() Any chance you could help?
Any chance you could help?
Are there any errors?
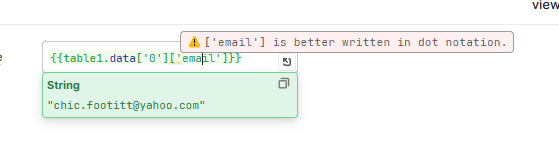
This is a soft warning instructing to use dot notation instead of ['email'].

I don't see the full code but I can guess after segmentedControl.value=='Subscriber Revenue' you have value for true filled out but you need to provide false value as well.
i.e.
segmentedControl.value=='Subscriber Revenue'?"something if true":"something if false"
In the example I gave previously I haven't checked for "Revenue" because if the segmented control has 4 values and I've checked for 3, 3rd being 'AOV' so if it isn't 'AOV' in that case it must be Revenue thus why value for false is subscribers_by_channel_by_day.data['revenue'].
Does that help?
Thank you SO SO SO much! Your explanations were amazing - I really appreciate all the help!