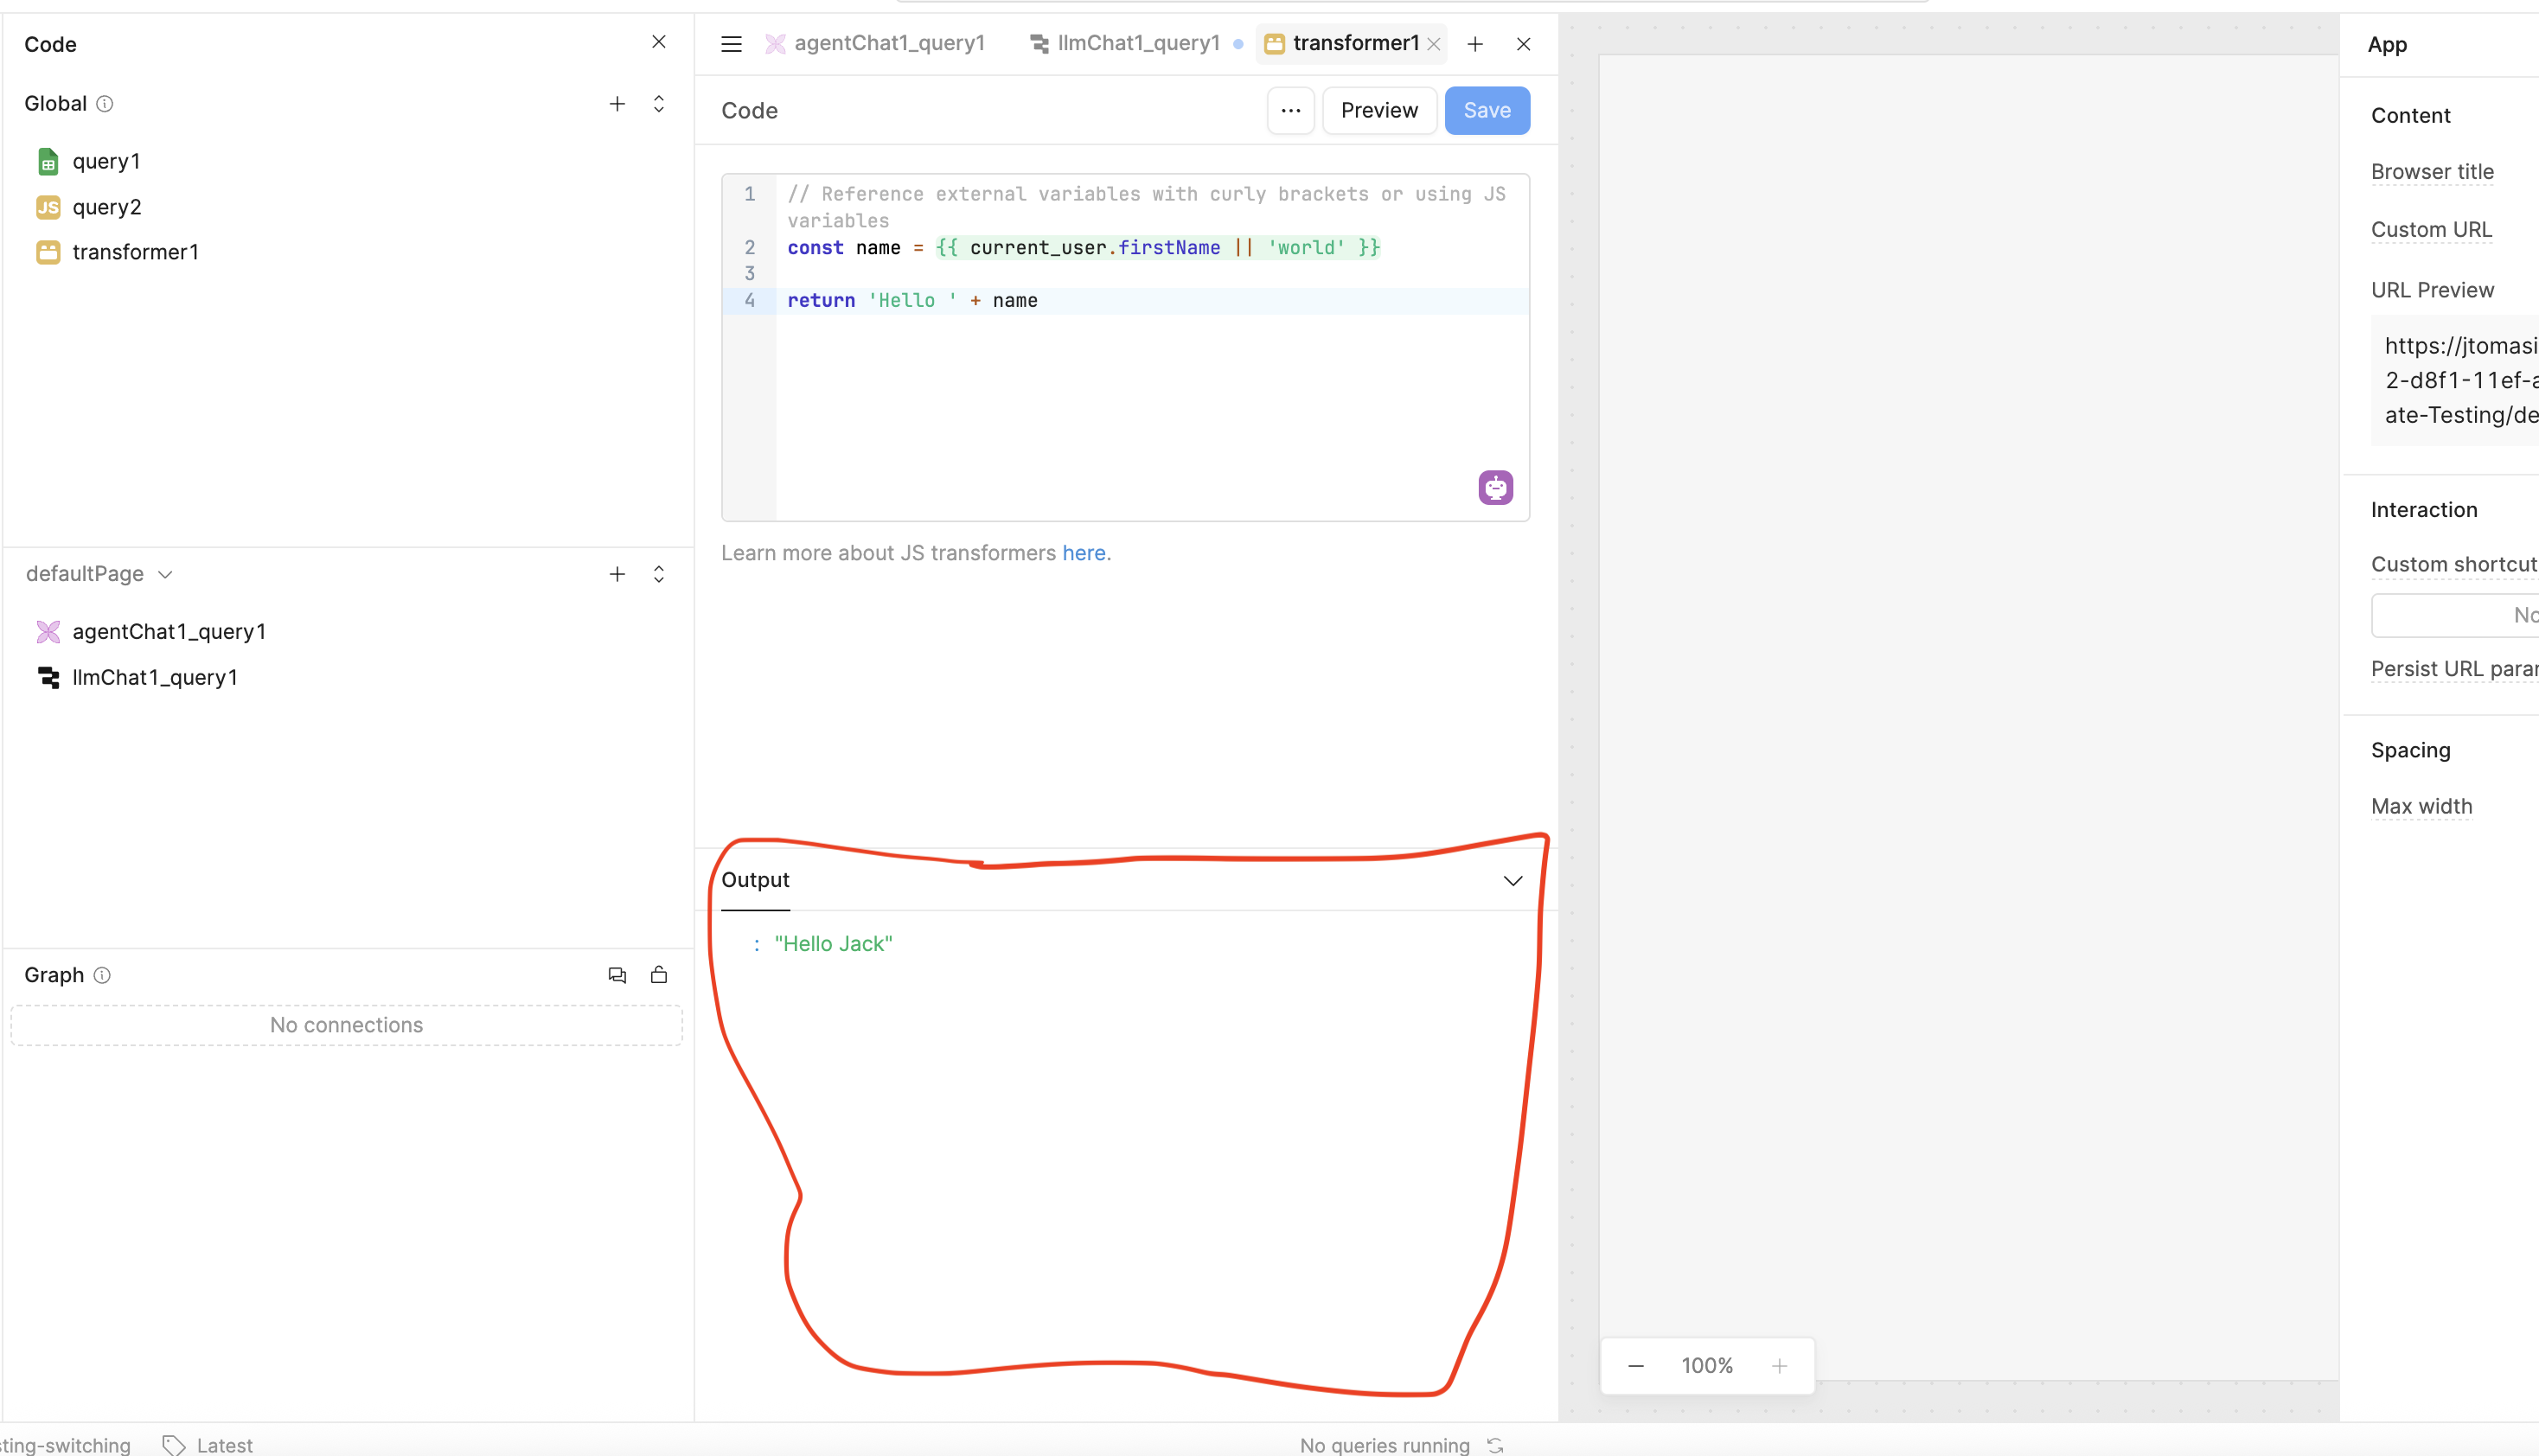
- Switch my view to look at a transformer that may contain lots of data and not have my browser tab hanging up:
- It feels like the code preview side bar really chops down app performance. Even a fairly small amount of data being previewed here will make the whole environment lag terribly.:
- Closing the preview flyout will allow app to instantly start perform quickly again:
- I am using the cloud version. Folding away the preview does not always work. When saving changes to a transformer for instance, the flyout pops back out and then everything jams up. Or when navigating from the canvas back to a transformer, also the flyout seems to pop out and crash everything. I do not think I have too much data in the transformer. When using the app and the transformer data is being populated into tables and list views, the app is normally responsive.
Hi @Shawn_Crocker,
Apologies for the trouble loading the transformers. Just to clarify are you talking about this part of the code preview sidebar?
Yes. That's right. Just as an example
I pull in 32 items from a retool database query
The query contains about 25 columns and I formatAsArray()
As soon as the JSON loads into the preview, things slow to a crawl. There is even a 1-2 second delay between typing and seeing the character on screen. This happens with any queries with a similar level of data going into the preview.
As soon as I fold away the preview, everything jumps to life.
Main problem I have with this is I cannot stop the preview from popping back out after running the query and sometimes when it pops back out, depending on how much data is in the preview, It often takes over a minute of the page not responding before I can finally click the fold away button.
1 Like
Thank you for the details!
I am really sorry to hear that the performance falls off so much, that definitely shouldn't be happening for that number or rows/columns ![]()
Let me raise this with our performance team and see if they can deduce anything from the logs if your org in on the cloud. What is your org name?
Does the slow down/crash not occur if you trigger the query via a button and have all the left side panels closed?
No, there is no extreme performance hit when the query is triggered with the code folded away. Our org is trebormanufacturing
1 Like
Ok good to know.
I am working with one of our engineers right now but we have having some trouble reproducing this behavior.
They are wondering if you could provide a image of the debug console's Timeline tab while the issue is occurring.
Also they asked if you could get a performance browser trace to share with us as well ![]()
I would love to provide the performance trace. I'm afraid your going to be specific then just, "a performance trance". What information are they wanting focus on? There's a lot of information available in the performance tab.
sorry to butt in here, but perhaps you meant to also link Save and share a recording @Jack_T?
idk what all is in it, so maybe send it in a PM or email or something
1 Like
Thanks @bobthebear. I hadn't picked up on the little record button which easily records and packages everything up. @Jack_T, I just sent you a message with a link to the requested files. In the supplied videos, you will see me demonstrating the performance difference between navigating to the query while its preview flyout is open and navigating to the query with its flyout closed. This is not an extremely bad case because I need the app to be responsive enough to keep from tab hanging up during the video.
2 Likes
Hi @Shawn_Crocker!
Thank you for sending that, I forwarded it our apps team.
They haven't been able to reproduce this behavior on their end ![]()
They tried to load the JSON trace but it doesn't seem to. load for them. The engineer I was talking to said this is likely either that the app got corrupted and the best solution would be to start fresh with a new one. Or that this may be some kind of version compatibility issue.
@Jack_T That's very surprising that I'm the only one seeing this behaviour from the results preview fold out on any computer I edit any of our apps from. It's also quite surprising to suggest we attempt to conceive of an event that could have corrupted every single one of our apps so that they all produce the same performance issue that apparently nobody else in the world is seeing. ![]()
I agree that is very odd. It seems like no other users have jumped onto this thread so I don't think this is related to a Retool glitch or outage.
My best guess is that the size of the data is causing latency and that the transformer may be bloated. Maybe have formatAsArray() run as its own query/transformer, etc.
Best practices would be to break things down into more encapsulated logic. This way when you need to make changes or run a query/transformer for testing purposes it doesn't need to load through all of everything. What are you using to trigger the query that is causing the query editor/preview panel to open up unexpectedly? This should stay closed until it is opened via the left most panel ![]()
In terms of the fly out being the source of this issue.
If I run a query by using the run button, the preview opens up on its own. If I save a transformer, the preview opens up on its own. These are intended behaviors right? It's been that way all three to four years I have been working in retool. I'm having a hard time explaining this any better and its baffling to me this issue seems so complicated. What I'm experiencing is very straight forward. Anytime I'm doing anything in the system anywhere, working with any component while in edit mode, and the results panel of a query or transformer is visible in some way onscreen, the systems performance drops significantly. You saw the videos right and the huge difference in loading a query into view with the panel already opened vs with the panel folded away? If I was to load the same data into a JSON explorer component, I don't get the slow down.
I didn't think it was best to break a process that only needs one transformer into more transformers. Doesn't that just mean you now have more components for the JavaScript engine to render asynchronously? If I only need one transformer and the code is concise for understanding, isn't it better that way as opposed to forcing a single processing thread to bounce between more smaller processes?
FYI, looks like some others are having similar issues in this thread. Performance Issue – System Slowness and Lag During Edit Operations
I see more threads with people describing similar issues to mine but there are closed. Some with no real solution.
@Shawn_Crocker Ok I was unsure if the query panel was popping up at unexpected times, when it should not be. If you are manually running the query or saving the transformer then it sounds like that is working normally.
From the engineer,
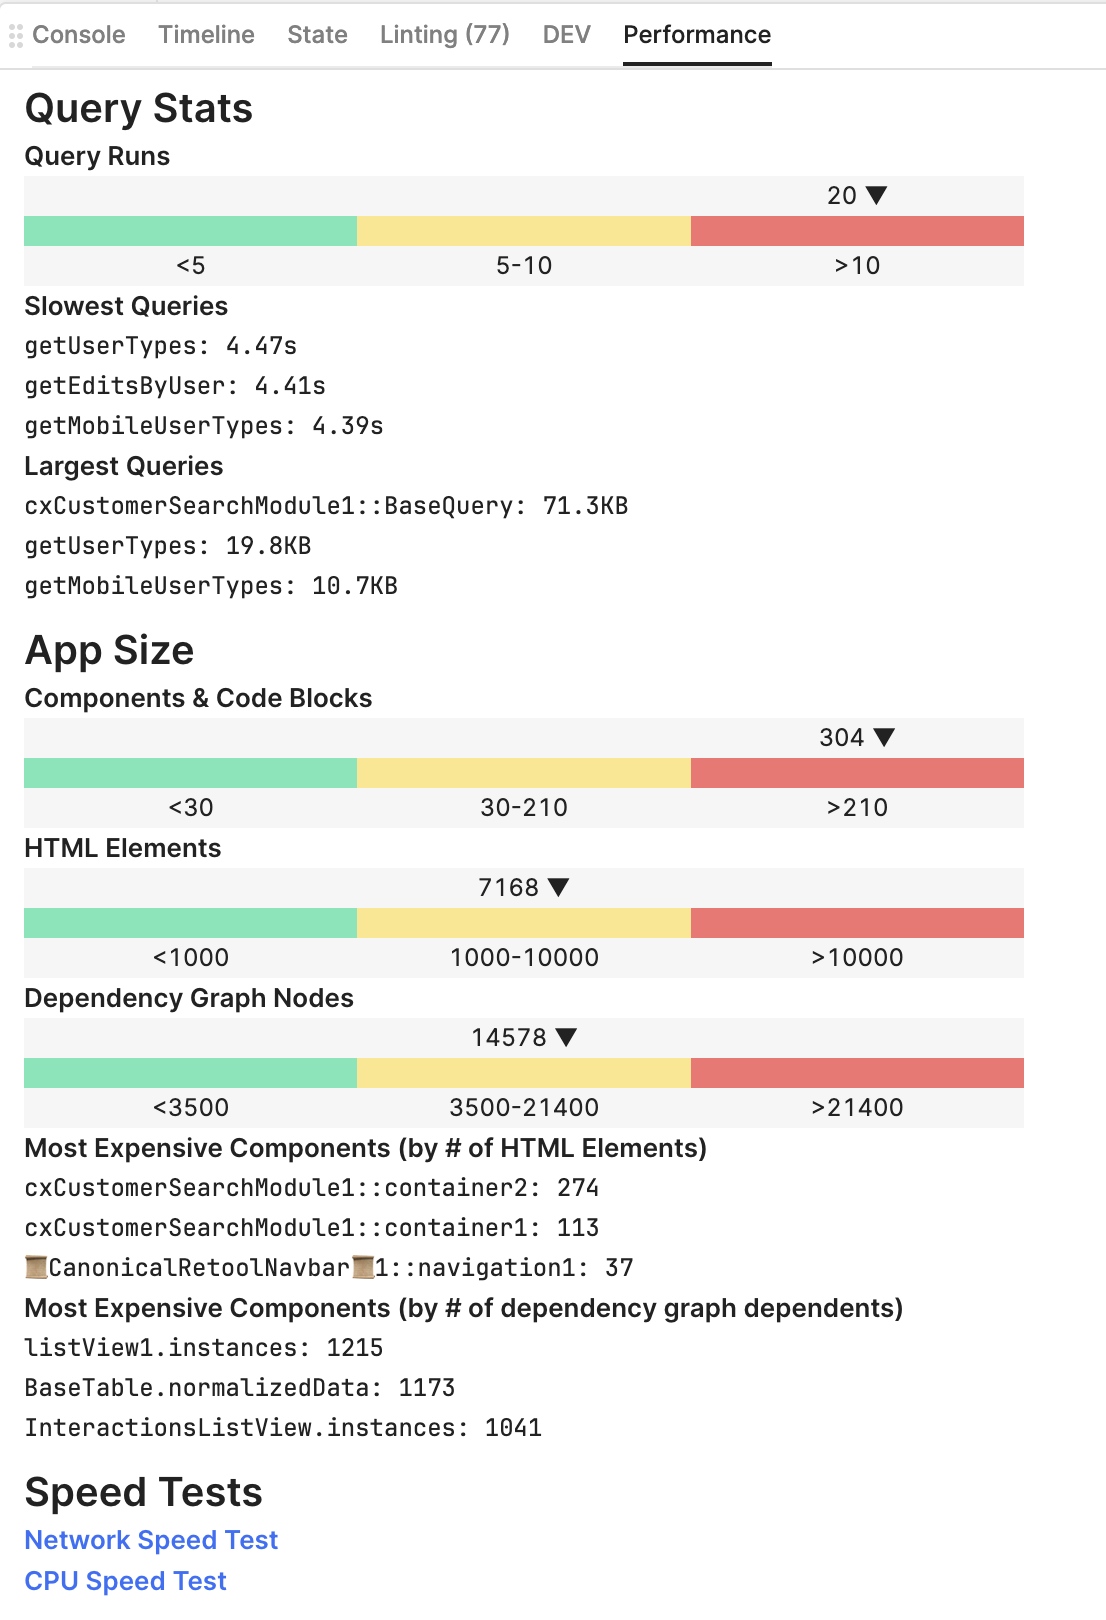
"Looking further into the videos, my guess is the transform happening in a big query is probably the issue. Just to confirm, it's only when the preview panel is open on the query with the transform, not just preview panels on other code? It's odd to me that the time the query says it takes to run in the debug panel is so short in comparison to the poor performance experience. I'd be curious what the performance tab of the debug panel says. I do think this is a bit out of my wheelhouse (it's hard for me to tell if the SQL query, the additional scope, or the transformer itself are the problem), I'll look at the preview panel code to see if there's anything that stands out to me"
We have noticed a number of posts from cloud users reporting slowness in the app and we are escalating that to engineering as we are not sure what is causing this. Apologies for the issue.
Just to clarify for the engineer(for what feels like an uncountable amount of times) this performance issue surfaces when the preview window is open on any query or transformer. This is not just an issue with queries or SQL queries that have transformer on them. It's with anything that has an output preview panels. So any query or stand alone transformer. The query reports an acceptable amount of time to complete because the performance issue only arises once the data is retrieved and then pushed into the preview panel. Surly Anyone on your end would see this if they just performed a test by loading in a heavy amount of data while having the preview panel open?
If the issue is being caused by loading in a heavy amount of data, then performance will likely improve by reducing the amount of data being loaded.
You can learn more about using batching and pagination on our docs here.
Aha. I was suspecting you would jump on my use of the word "heavy" to try and dismiss this issue. I suggested loading in a heavy amount of data so that the issue would be extremely apparent for you and you couldn't miss it. No offense but I'm getting suspicious I'm getting help from an AI right now. It feels like I have to keep reiterating what seems like obviously critical details in the same way I do to keep Gemini on track with the topic. There are no app performance issues with the amount of data I'm loading in. It's only when the output preview is opened up. BTW, I'm the one attempting to help you get to the bottom of a issue with your system right? By all means, if your not up to putting in the effort, just say the word and I'll drop it. I'm sorry for being a bit rude here but it feels alot like any performance related issues are always trying to be swept under the rug.