I have an app that runs a query against RetoolDB, and a transformer that transforms the results.
The query itself pulls about 5000 records, the transformed data results in about 1500 rows. I can run the query in DBeaver and it takes 2-3 seconds to run.
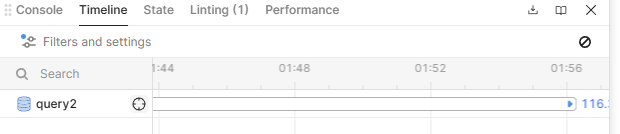
In the debug window, I can see the query running like this.
I can see the query in Dev tools as well, and it's done after the reported 2-3 (.89 in this particular case) seconds, Retool just keeps spinning it's wheels indefinitely for some reason I can't figure out.
I've tried deleting and recreating the query.
Limiting the results.
Changing it from an Automatic to Manual running query and triggering it via a button.
Limiting the results has some impact on the time it takes to run, but it has the same bug, where it loads for a minute or two, and then reports the query completed very quickly.
I'm taking the data and displaying it in a table with 2 fixed rows and then a handful of dynamic ones. This app is pretty new, it only has 2 pages, nothing complicated going on that I can see causing this.
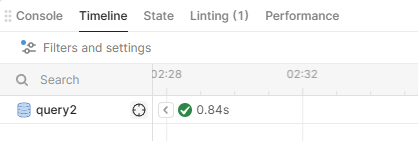
So the table that is connected to the transformer spins for the same amount of time as the query says it's loading in the debug panel. But as you can see, at some point, after a couple minutes, the debug panel says the query only took a couple seconds to run.
So basically:
Trigger Query
After 1-2 seconds, Query has data (according to state)
Query keeps running according to debug panel for 3-5 minutes
During this time, the table is in a loading state with the spinner spinning
Query is finally "done" according to debug panel, but says it took 0.84s to complete
Data appears in the table.
I know it's a bit weird to explain, but that's what's happening.
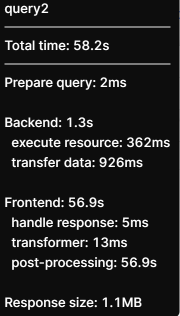
I'm not sure what is included in post-processing, I don't think I have anything complicated going on in the table. One column has a copy-to-clipboard onClick event and an overflow tooltip. The other columns are just numbers.
Mmm, interesting. Yeah, that post-processing seems very weird. When you have your transformer state open, does it load right away, or does it load right after the 56s?
It looks like this was an issue with the transformer, though also a UI bug which made it a bit hard to diagnose. I updated the transformer to leverage Maps instead of working on the data object and it's much faster. Thanks for looking into this @MiguelOrtiz and pointing me to dig deeper on the transformer data.
I will share this feedback internally. It looks like we've gotten a couple of reports of this happening to other customers in the past, but so far, it's inconsistent and difficult to reproduce.
For future reference, our docs have some information about what's happening at each step in the query tooltip: Query performance | Retool Docs
I'd say in this case, the transformer time in the tooltip was wrong and it was being attributed to post-processing, because when I optimized the transformer, everything got much faster, even though the output data was the same (same impact on all components).
Also, maybe just a quirk of how it's displayed, but the timeline showed the full length of the query while it's running, but once it's completed, the timeline only shows the backend time.