Chart in mobile don't show the same as PC web browser

layout:
{
"title": {
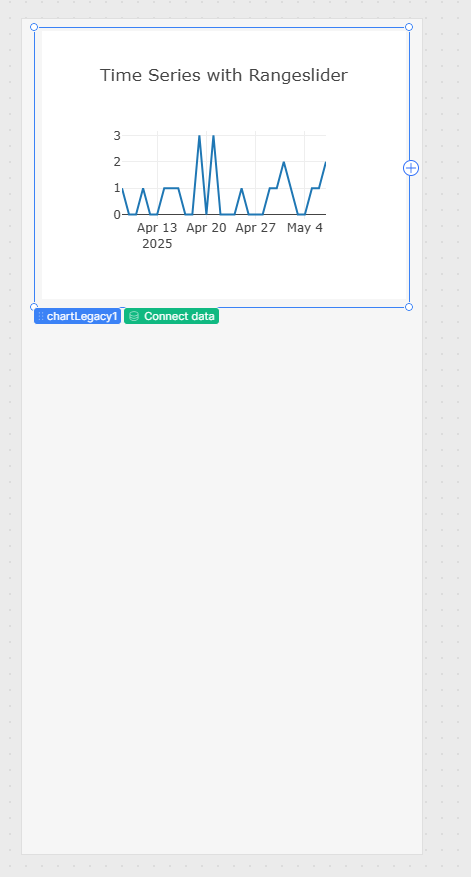
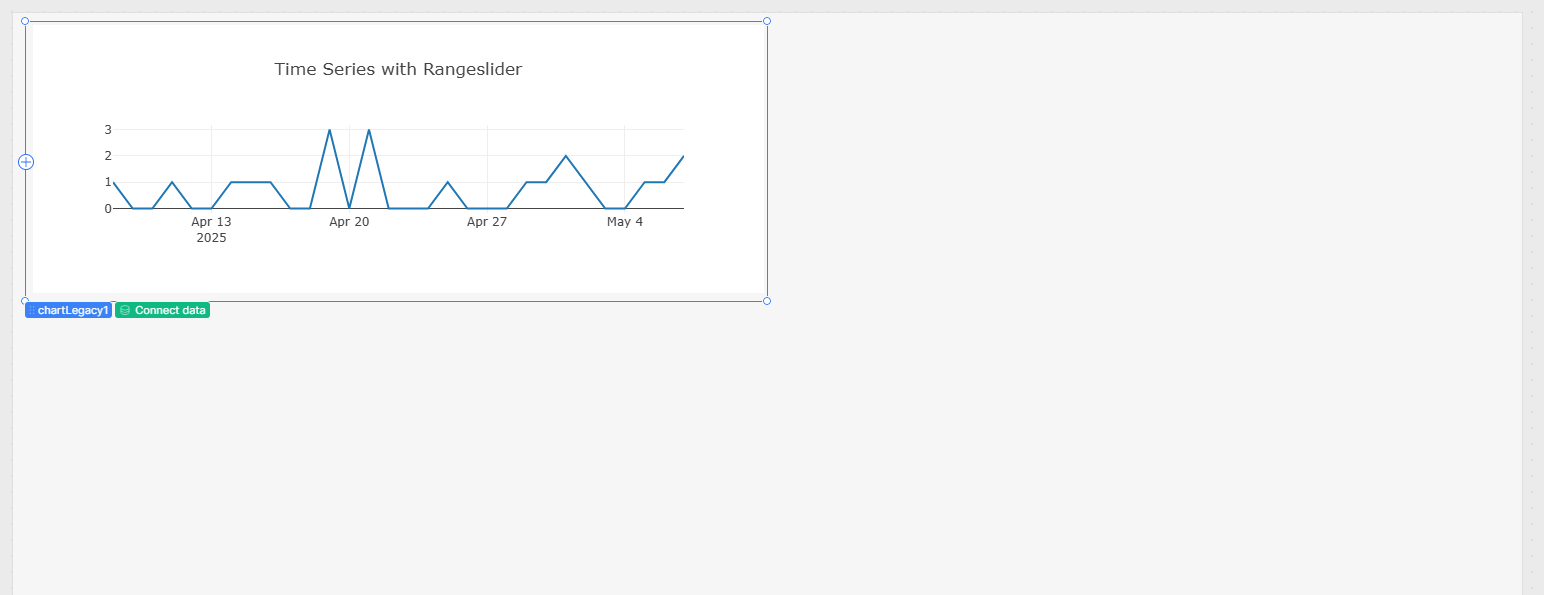
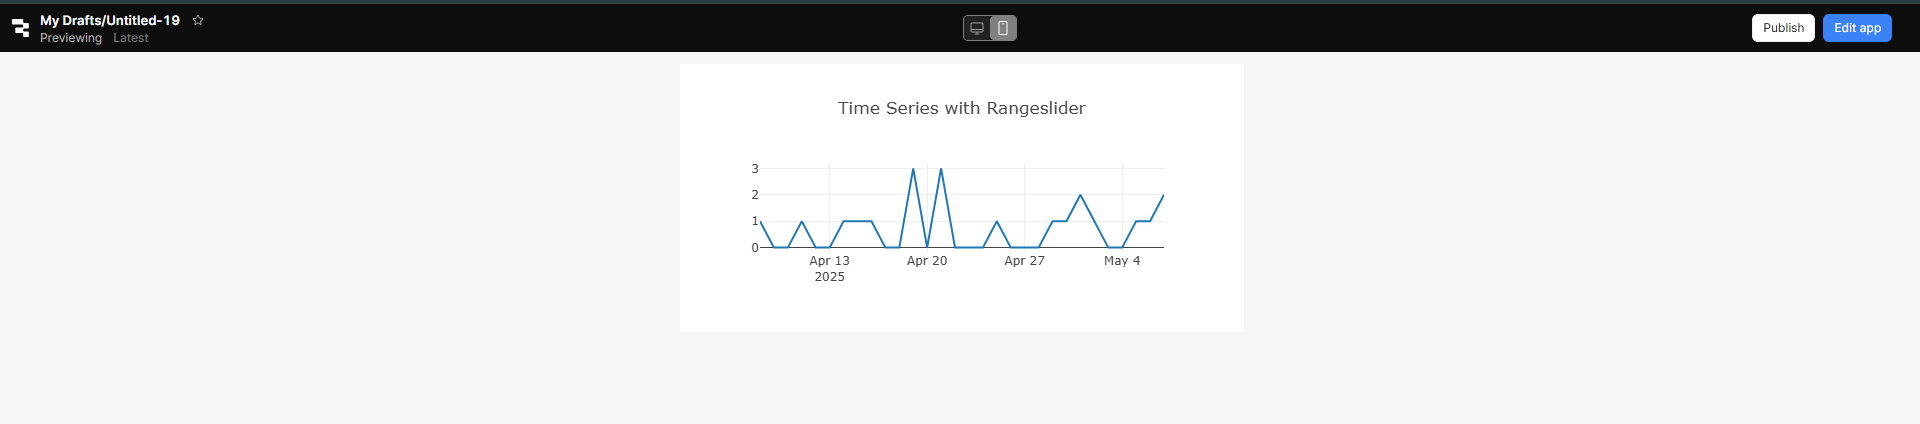
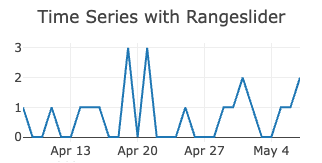
"text": "Time Series with Rangeslider"
},
"xaxis": {
"type": "date"
},
"yaxis": {
"type": "linear"
}
}

data:
[
{
"x": [
"2025-04-08",
"2025-04-09",
"2025-04-10",
"2025-04-11",
"2025-04-12",
"2025-04-13",
"2025-04-14",
"2025-04-15",
"2025-04-16",
"2025-04-17",
"2025-04-18",
"2025-04-19",
"2025-04-20",
"2025-04-21",
"2025-04-22",
"2025-04-23",
"2025-04-24",
"2025-04-25",
"2025-04-26",
"2025-04-27",
"2025-04-28",
"2025-04-29",
"2025-04-30",
"2025-05-01",
"2025-05-02",
"2025-05-03",
"2025-05-04",
"2025-05-05",
"2025-05-06",
"2025-05-07"
],
"y": [
1,
0,
0,
1,
0,
0,
1,
1,
1,
0,
0,
3,
0,
3,
0,
0,
0,
1,
0,
0,
0,
1,
1,
2,
1,
0,
0,
1,
1,
2
],
"type": "scatter",
"mode": "lines"
}
]

view in pc


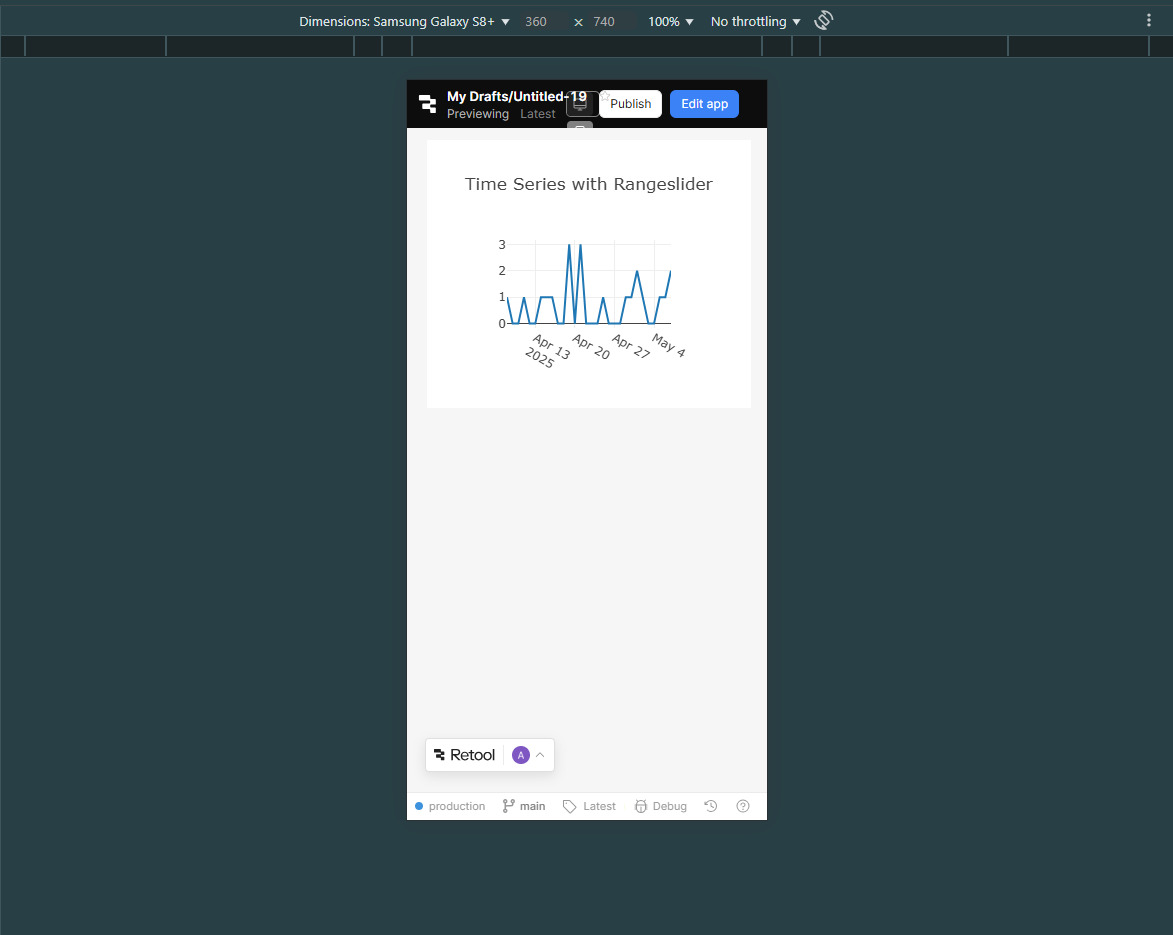
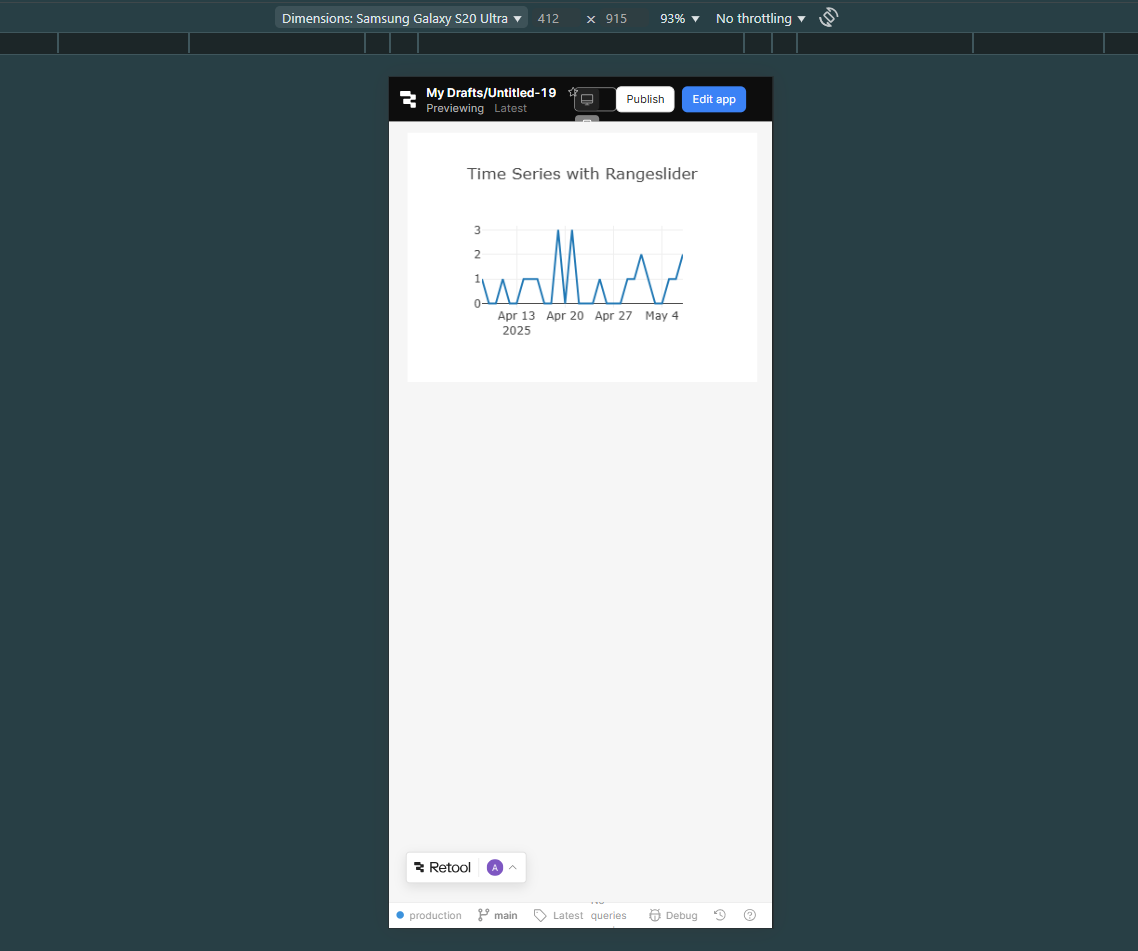
view in samsumg phone

Hey @AnsonHwang

I tested your data in my app, and it works perfectly on both the web and mobile versions.

However, for the mobile app, you may need to make some adjustments to the chart layout. When I initially opened the chart on mobile without any changes, it appeared like this:

After making some layout adjustments, the chart displayed correctly, as shown below:

Here's how it appears on the web app:

In preview mode:


In samsung mobile:


Hello, could you share you layout detail? thanks.

Thanks, it my fault, it seem another bug case this. I have report it, _ lodash can be referenced in function, this happen only in mobile.

@AnsonHwang

Just enable the mobile Show on mobile option it will automatically work for the mobile.

And for checking mobile view or web app view you can click on it