Dear community,
I am setting up a Mapbox visualization that includes a GeoJSON with all of germanys zipCodes such as a count for sales coming from the area.
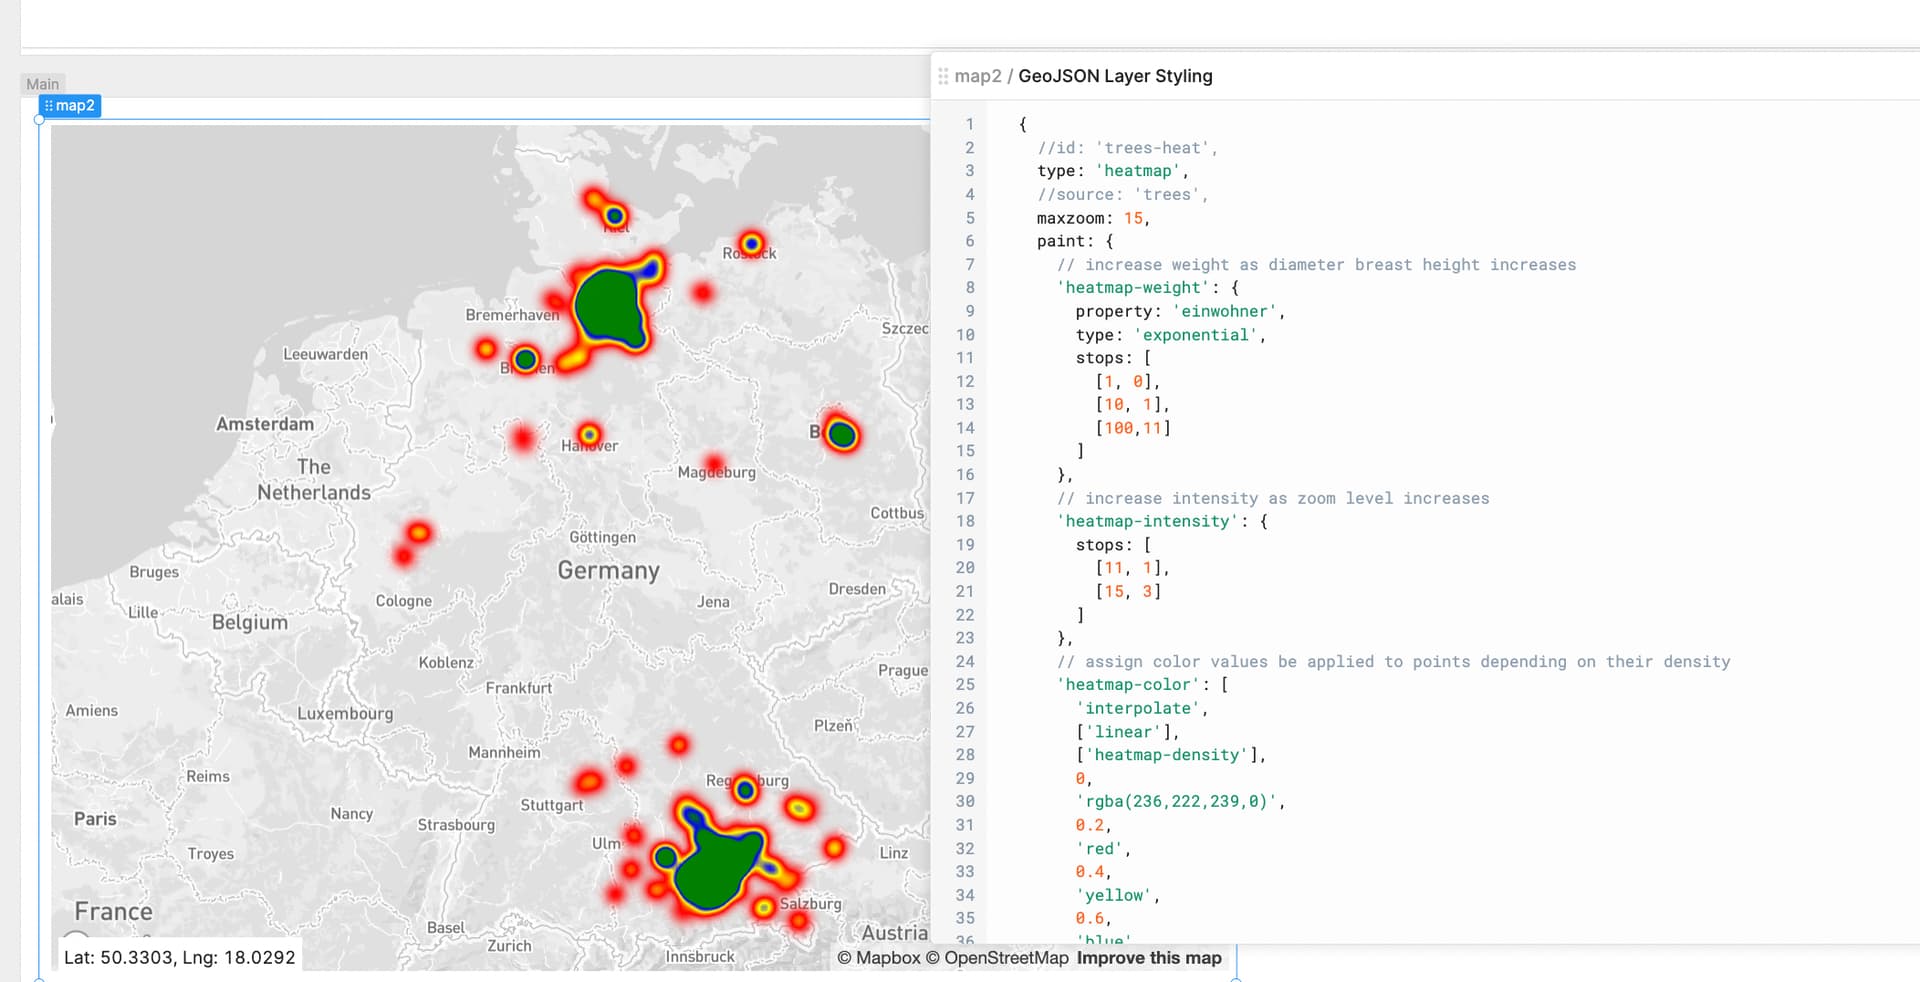
Now what already works fine is setting up a heatmap, following the Mapbox documentation on how to customize Layer Styling. (see screenshot)
What I really want to achieve is to use the default "fill" type for visualization, so that the data will be shown in polygons. The only problem here ist, that whenever I try to change the "fill-color" it will be used globally so that the whole map will turn blue. Of course I want to specify color depending on count clusters e.g. 0 = white, [1,10] = blue, [11,50] = red, etc.
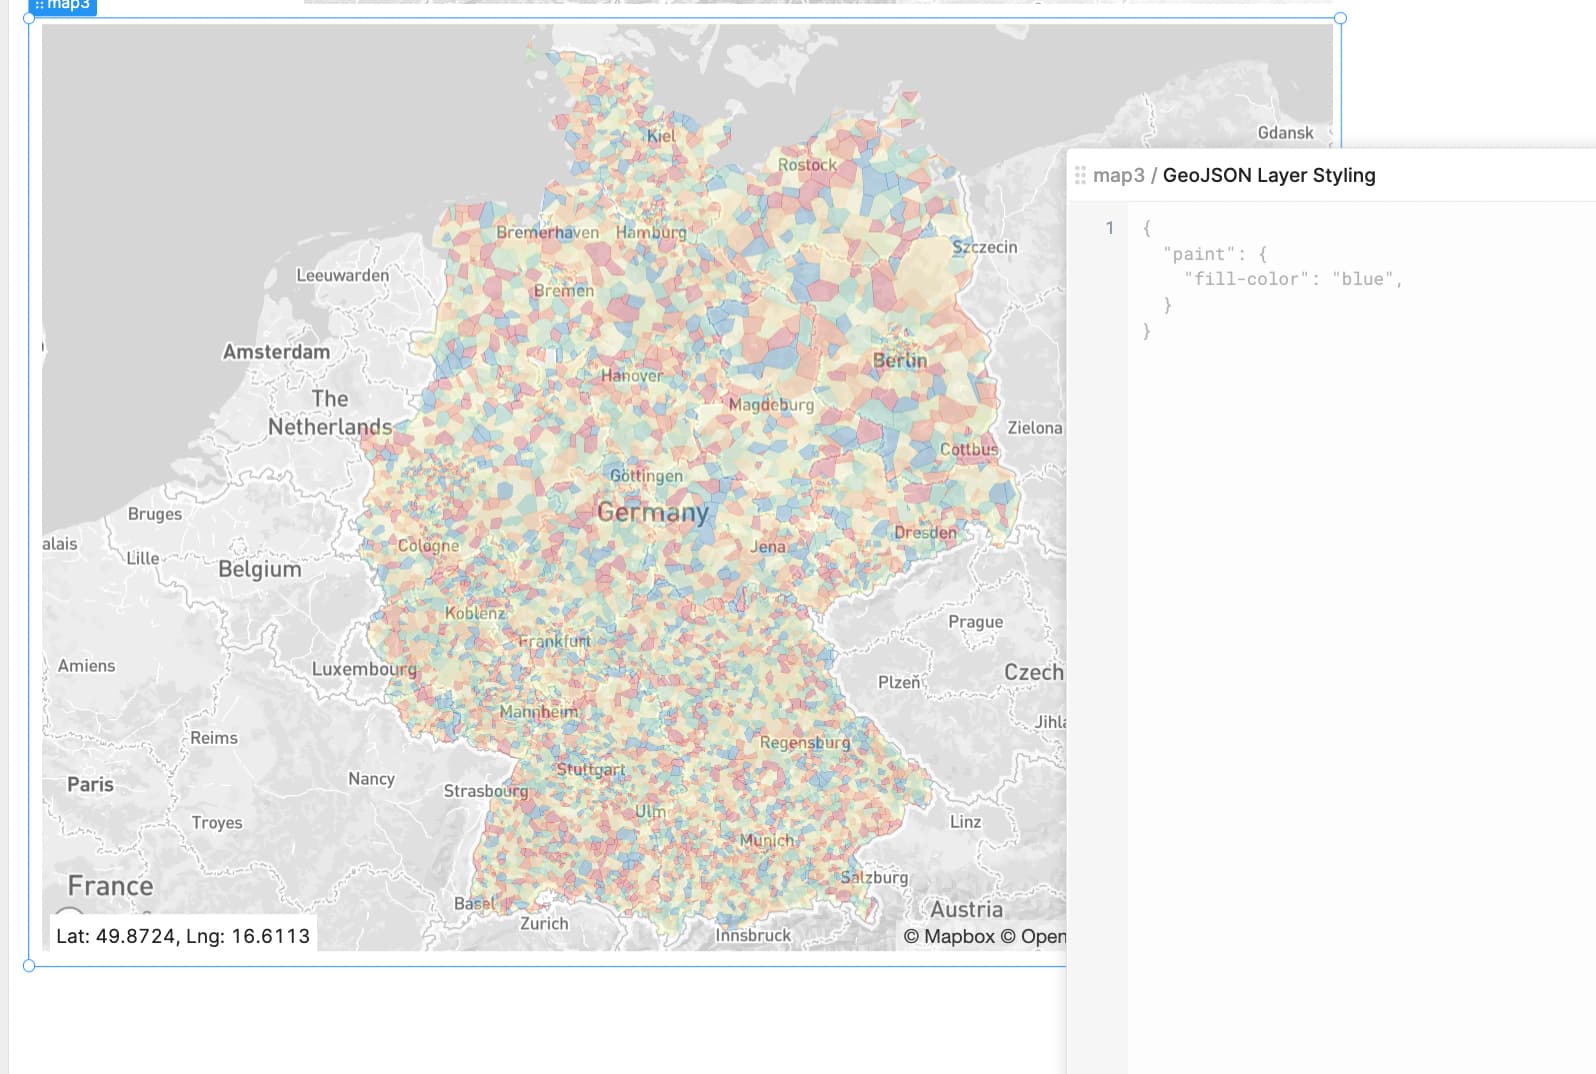
Is there a way to change the colors depending on count value in the geojson object?