I am currently working on an app that will show the location of each customer, grouped by dealer, on a map. All I have is the zip codes of the customers. This is my first attempt at creating such a map and I have a couple of questions.
Is there a way to either place a marker on a map by zip code or convert the zip code to the necessary coordinates?
The zip codes or coordinates are being collected through a SQL query. How do you enter the coordinates into the map so it can display all the points?
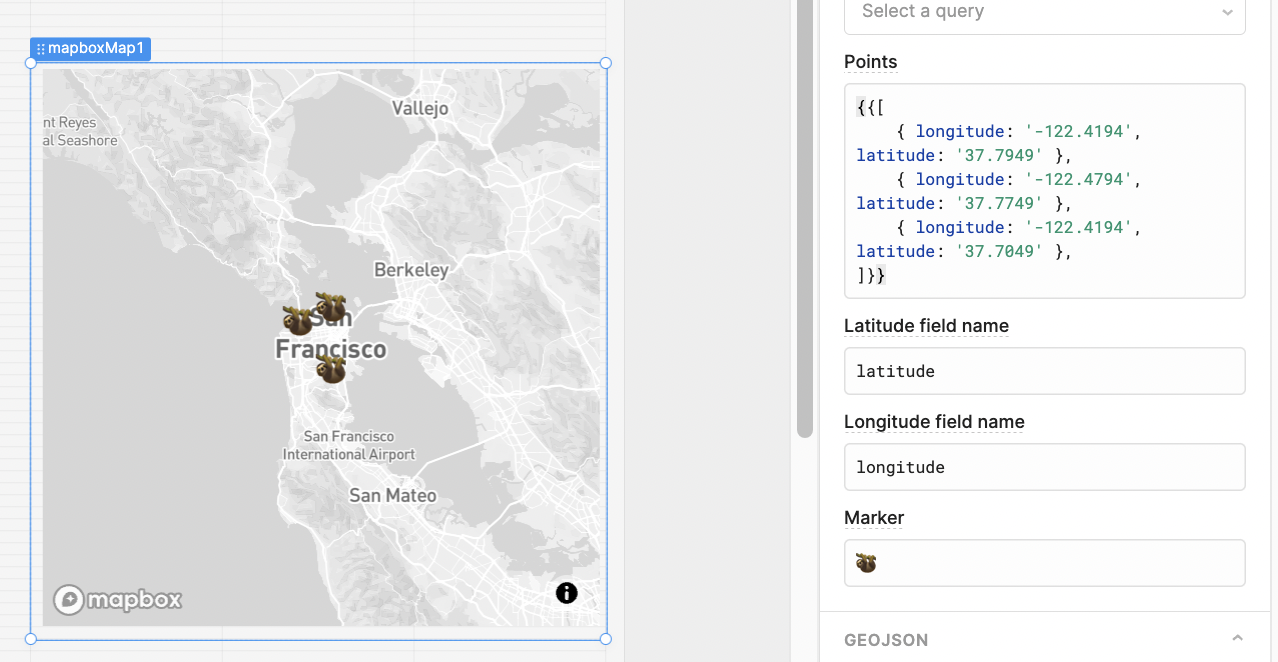
If you're just looking to display a marker for each set of coordinates you should be able to do so by passing them as an array to the "Points" field, you can also specify a unicode character to use as your marker if you'd like:
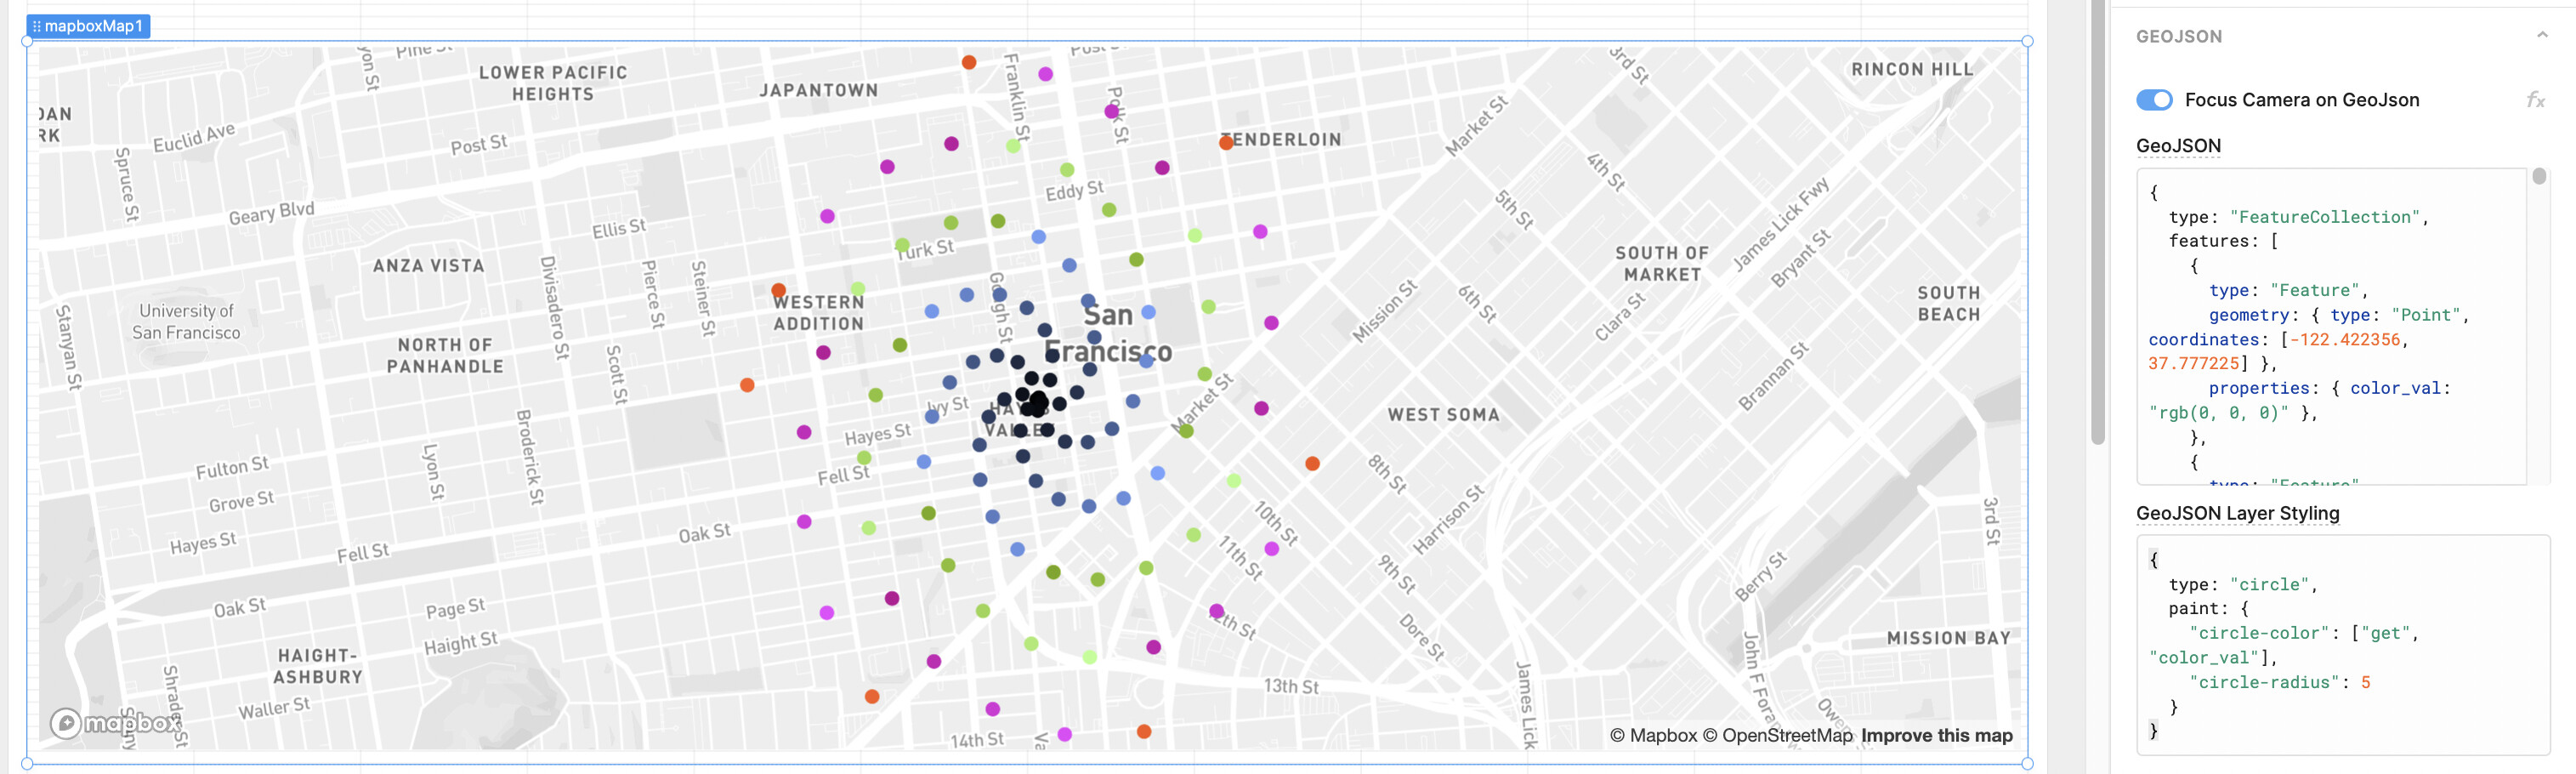
That being said, if you'd like more customizability you can try passing your points as a GeoJson object instead which lets you use MapBox's layer styling to draw the markers instead. This lets you do things like programmatically define the color for each point!
Let me know what seems useful. It might be helpful if you can share the structure you currently have for your coordinates and how you'd like to display them as markers. We might be able to provide more specific syntax for what you'd need in that case!
I did get the markers to work by using an array, however, having more control would be great. I'm just not that familiar with GeoJSON. I am currently pulling the data from a Google Spreadsheet using SQL. Is there a way to create the GeoJSON code programmatically from the SQL returned data?
Which we can generate from your SQL data using a JS query or transformer. You can try something like this, for instance:
const sqlData = formatDataAsArray(sqlQuery.data); //more info on this function here: https://docs.retool.com/docs/javascript-in-retool#data-conversion-1
const features =  sqlData.map((row, i) => ({
    type: "Feature",
    geometry: {
      type: "Point",
      coordinates: [row.longitude, row.latitude]
    },
    //this part is totally optional but you can define a custom color here with some javascript, values can be hex, rgb, or hsl strings see: https://docs.mapbox.com/mapbox-gl-js/style-spec/types/
    properties: {
      color_val: `rgb(${Math.floor(i * 2.55)}, ${Math.floor(i * 3.55) % 256}, ${Math.floor(i * 5.55) % 256})`
    }
  })
);

return {
  type: "FeatureCollection",
  features
}
That returns roughly the object pictured in the screenshot above, given the right lat/long data to get the spiral.
I guess I'm still confused. I am returning a dynamic number of points based on user selected criteria. In this particular case, I am attempting to display a marker for each zip code in a state where a sale has occurred. The user selects the state, so until the query runs, there is no way of knowing how many points there are going to be. In your basic structure, where is says more points, that is where I am confused. Also, and I'm sure this is a stupid question, would the basic structure code in the GeoJSON box under Inspect for the map component and the JS query would be set up as another resource query?
You should be able to pass in a dynamic number of points. The second code block is an example of a JavaScript query you can use to generate the GeoJSON data from whatever is returned for your SQL query. It just assumes your SQL query has a longitude column and latitude column.
You would set it up as another resource query, and then pass its data to the GeoJSON box using {{ yourJsQuery.data }}.
The basic structure code block was just to give an idea of what the output should ultimately look like and doesn't actually go anywhere in the app
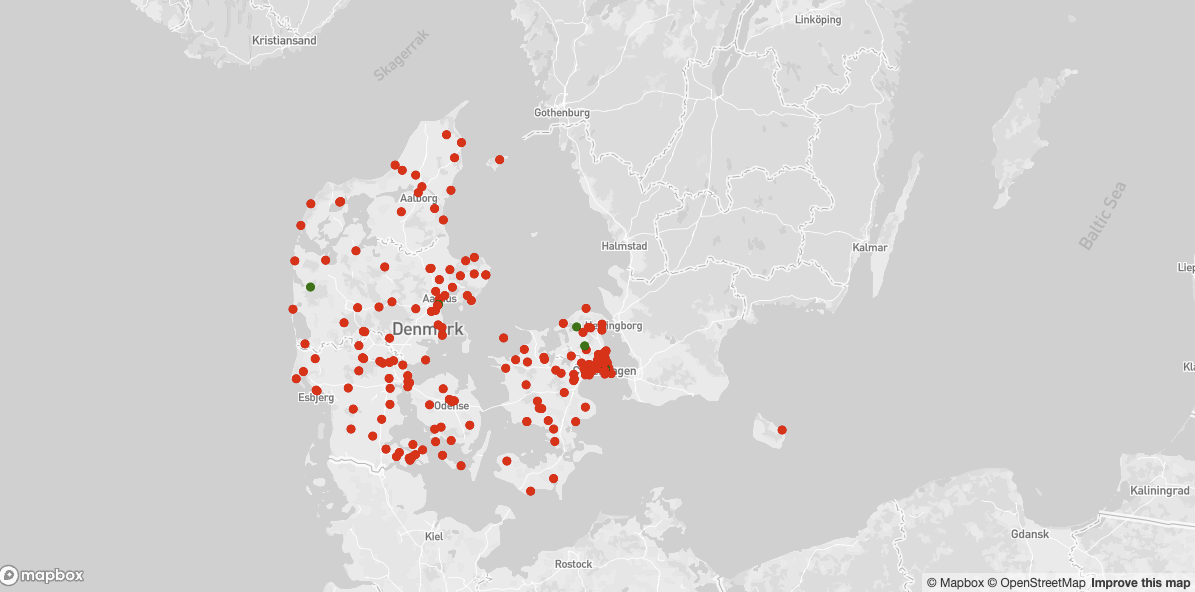
I've included a working example with some mock SQL data that you can play around with GeoJSON-20focus (1).json
would you mind sharing how the data you're passing to the script is structured?
It may be that you need to use const sqlData = sqlQuery.data; instead of const sqlData = formatDataAsArray(sqlQuery.data); or some other syntax to access the latitude/longitude data from your query.
Hey @Oliver! I'm not sure if this is possible with a single style layer. There's some documentation on how to do it with multiple style layers here but for that you'd need to use a custom component instead of the built-in map component. Is that something you've considered?
But now I need to make this map more like heatmap: color needs to be brighter for high density cities. Is it possible to do this in the Retools mapBox component?
Hi @mondob, I haven't implemented this myself, but looking at the Mapbox documentation, it looks like there is such thing as a heatmap, but it's a different way to mark the map, more like zones rather than dots. There are also circle-emissive-strength and circle-opacity properties we could use if your data provides a reference to which mark is located within high density areas.
This example uses the property "ethnicity" to give color to a mark. If we could find a way to set another property for each object from your "mapCoordinates.data," we should be able to make this happen.