How to format GeoJSON fields in Mapbox Component?

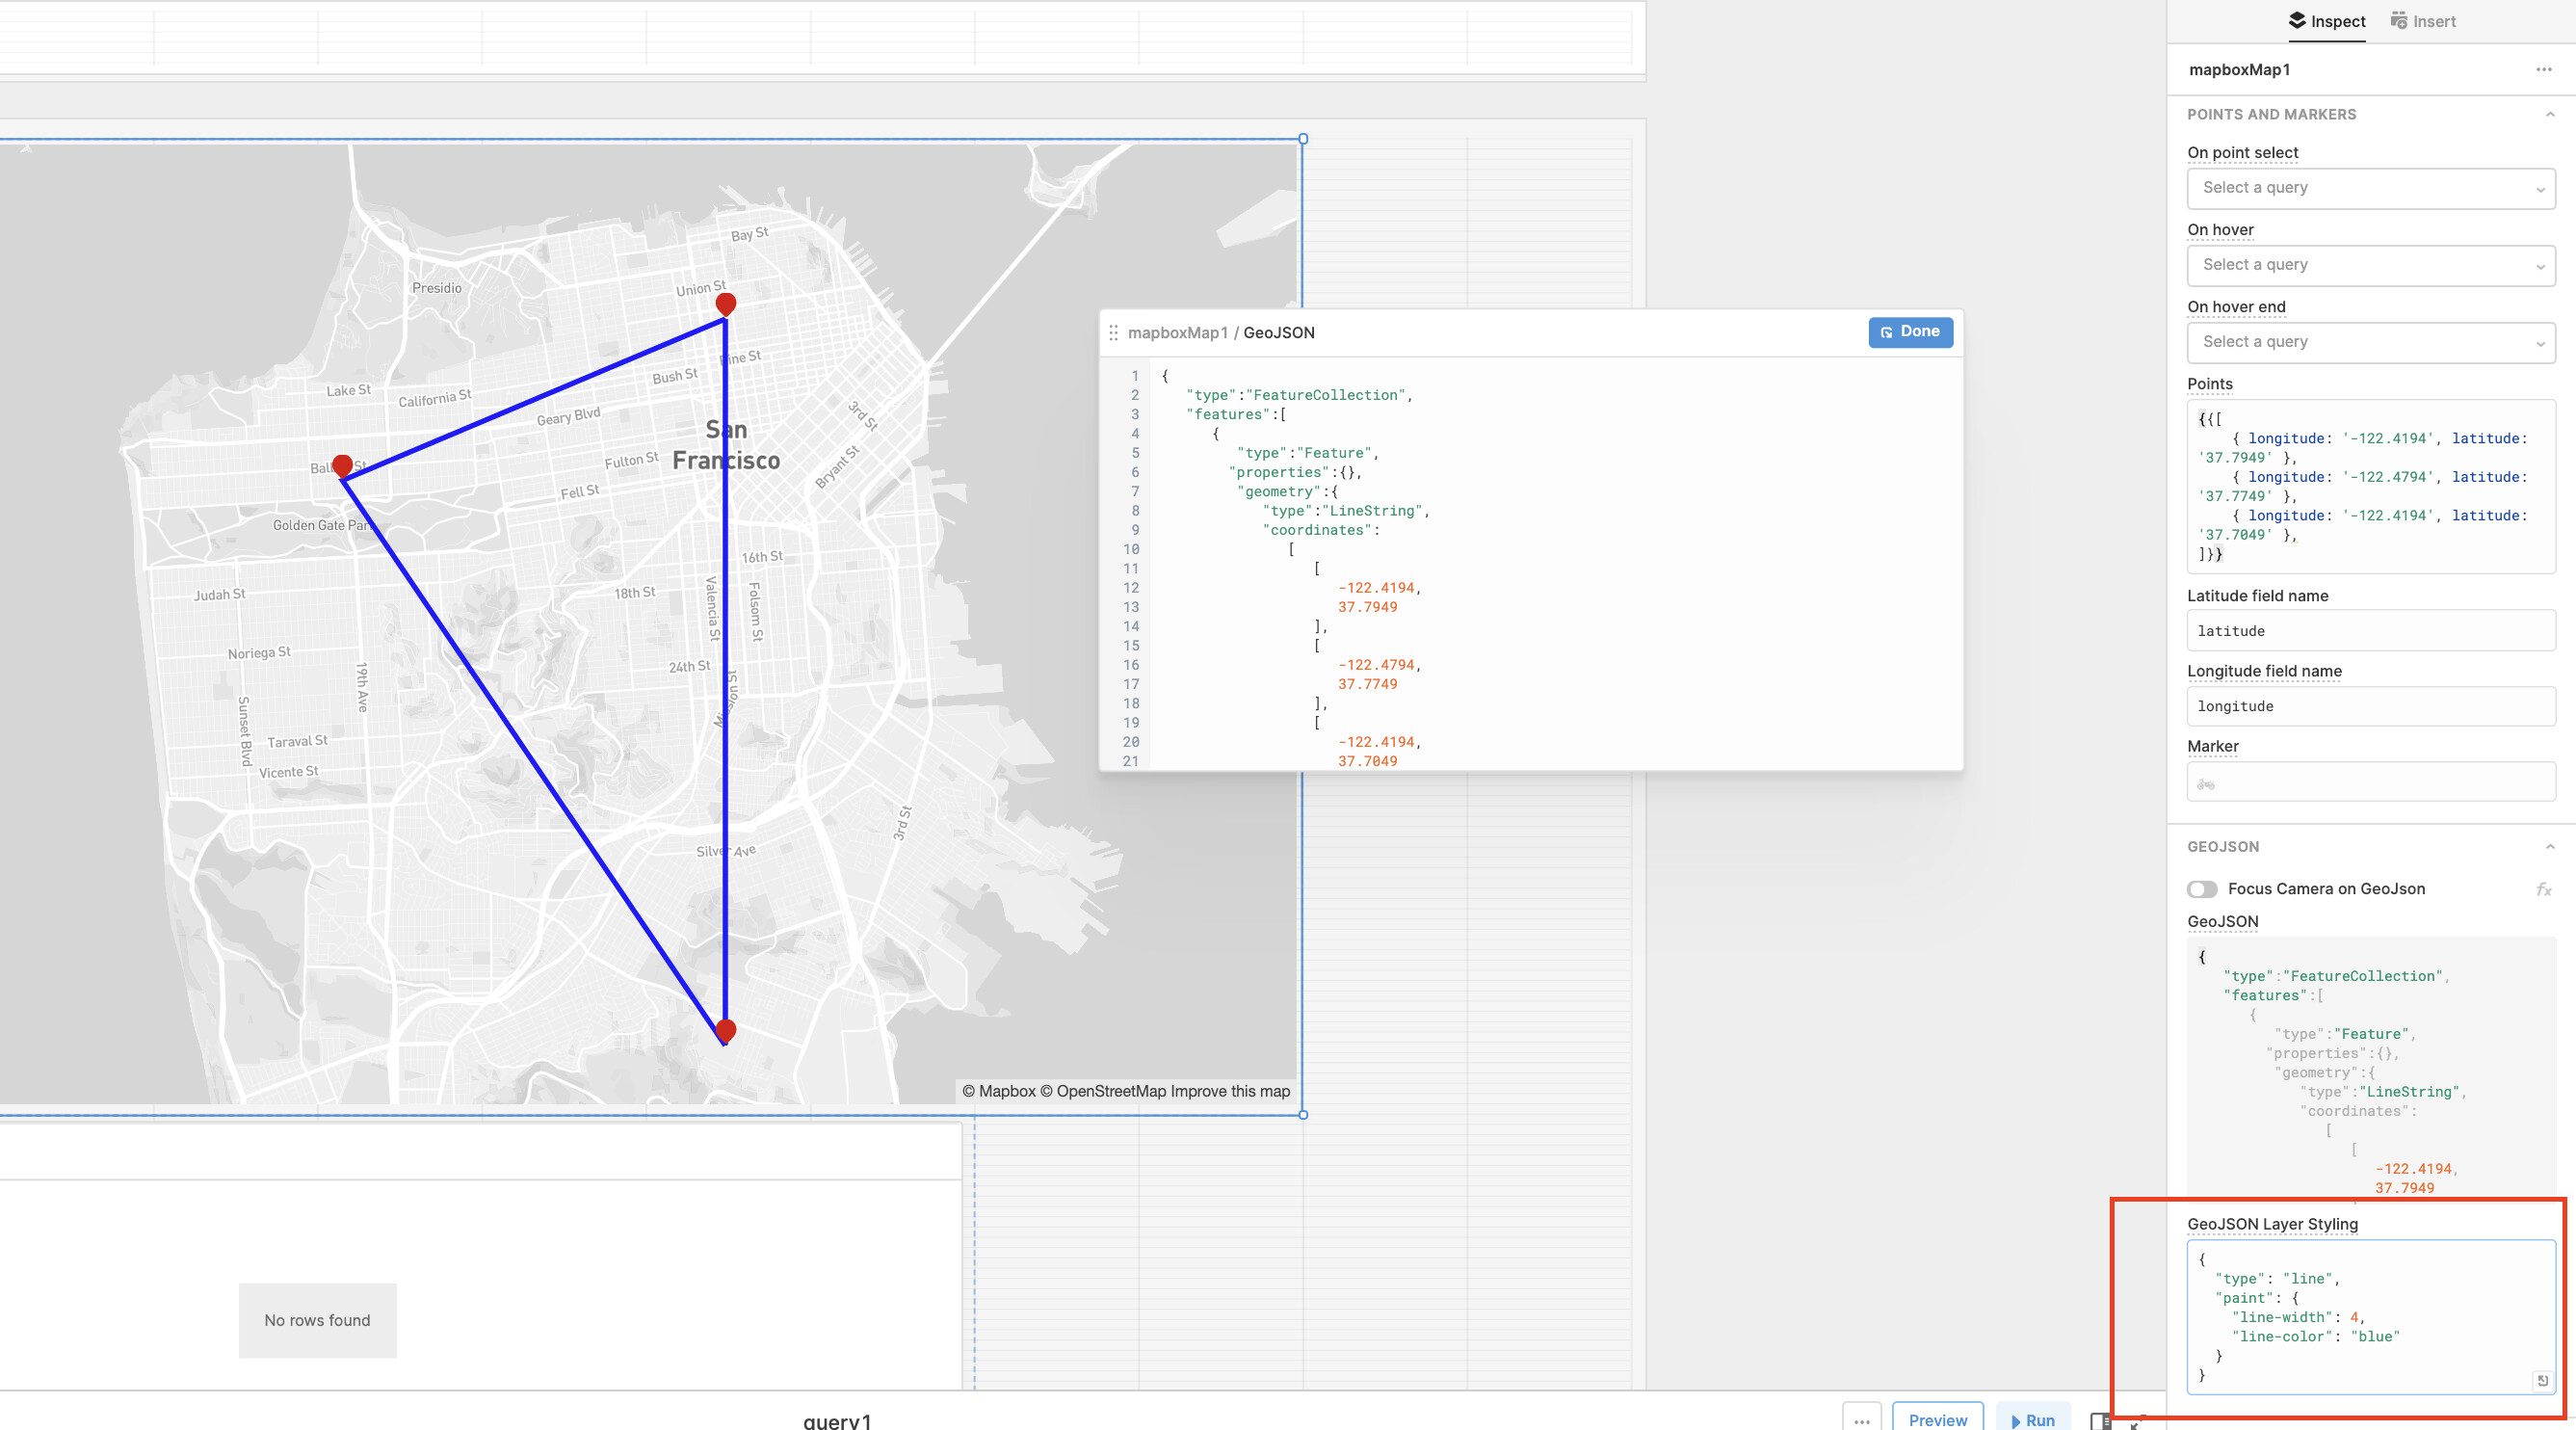
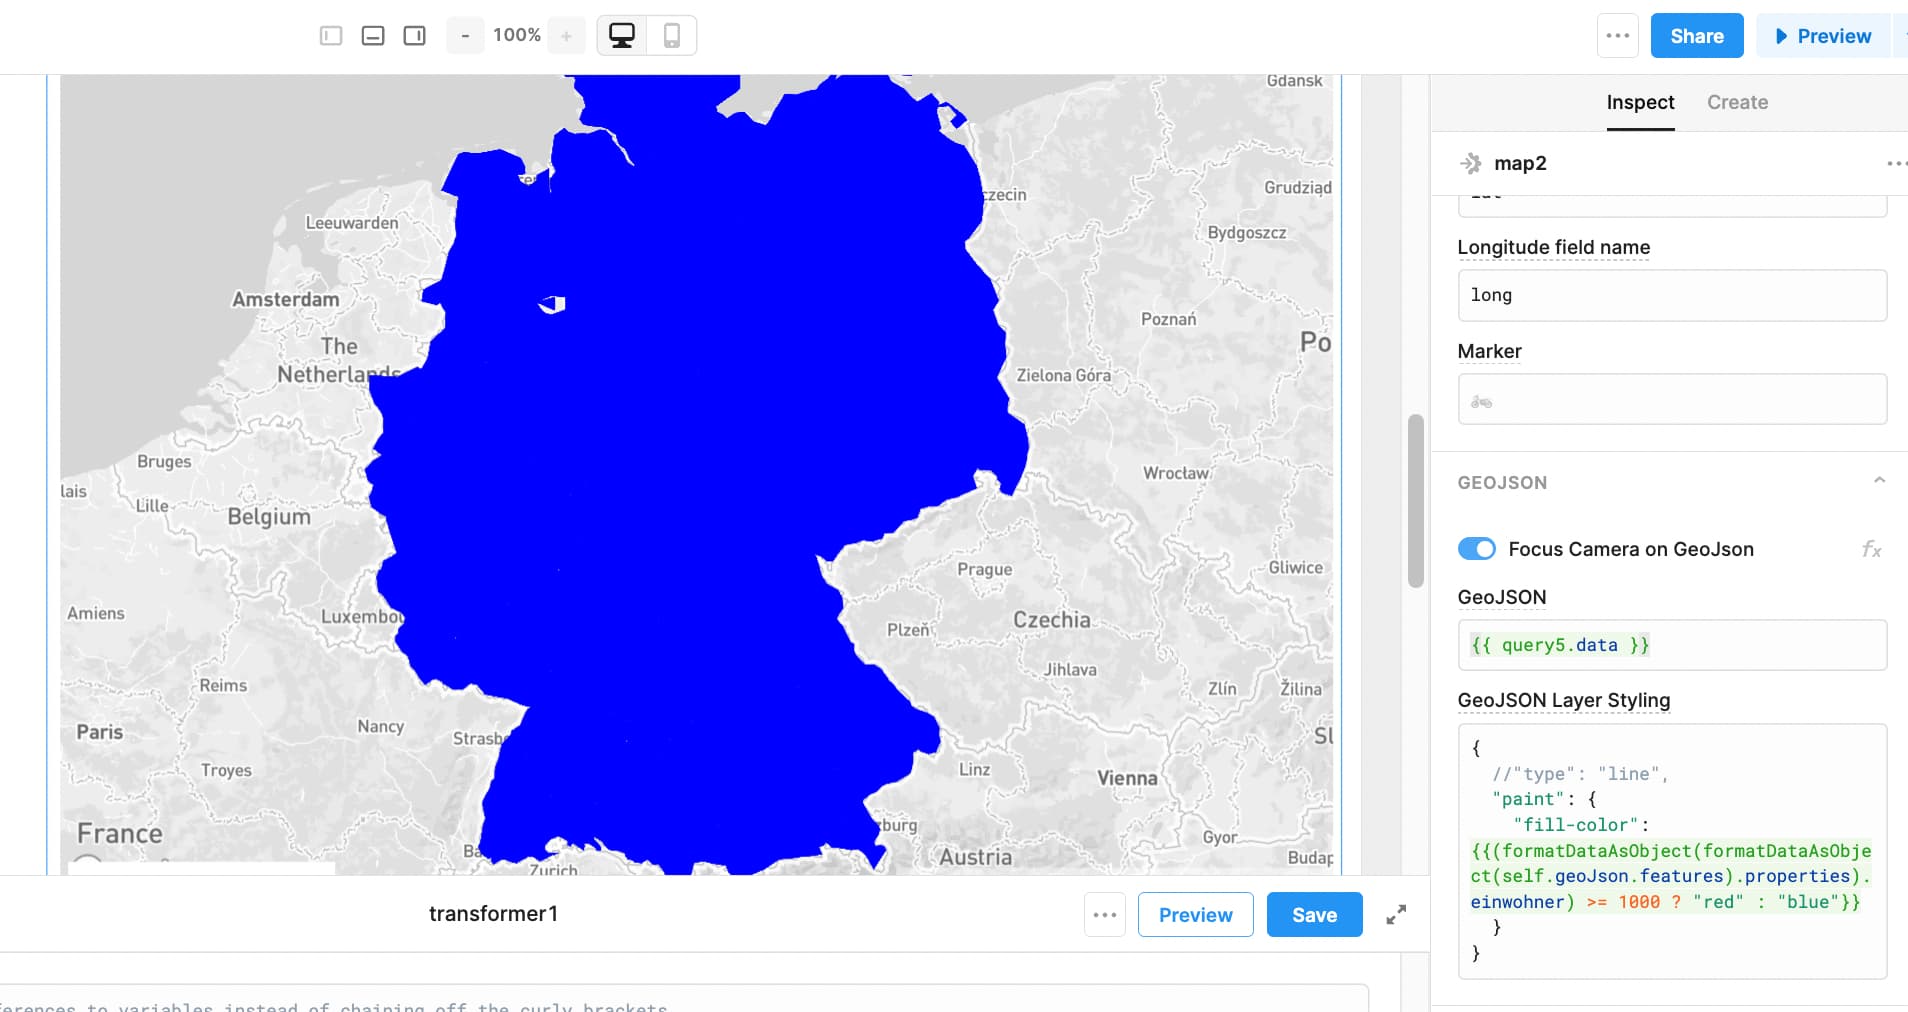
The GeoJSON field in the Mapbox component defaults to drawing polygons despite my data input formats each feature differently. As part of my application, I am attempting to pass in a feature collection that includes different features, including both Point and LineString, the Mapbox component only draws out the polygons defined by the features.

For example, this is what one of the features in my feature collection:

{
   "type":"FeatureCollection",
   "features":[
         {
      "type": "Feature",
      "properties": {
        "marker-symbol": "h",
        "marker-color": "#00ff00",
        "marker-size": "large"
      },
      "geometry": {
        "type": "Point",
        "coordinates": [
          -121.88059729999998,
          37.6575115
        ]
      }
    },
   ]
}

This however, doesn't display anything on the Mapbox component as it doesn't define a polygon. I've played around with the component and it only draws LineString such as this:

{
      "type": "Feature",
      "properties": {
        "stroke": "#00ff00"
      },
      "geometry": {
        "type": "LineString",
        "coordinates": [
          [
            -122.431672381187,
            37.74804142279605
          ],
          [
            -122.42343263509325,
            37.79743226839682
          ],
          [
            -122.28046687515496,
            37.82892297285295
          ],
          [
            -122.26707728775261,
            37.847360360442806
          ],
          [
            -122.25300105484246,
            37.85345995188226
          ],
          [
            -122.21849711807488,
            37.819431344664885
          ],
          [
            -122.27372039204265,
            37.78195899281015
          ],
          [
            -122.23973143940593,
            37.76486231642276
          ],
          [
            -122.18441316651639,
            37.74539316887111
          ],
          [
            -121.88059729999998,
            37.6575115
          ]
        ]
      }
    }

Is there a better way that I can utilize this component?

I'm struggling with the exact same component and problem. Polygons work fine, but linestrings and points do not. I have tried every online example I can find but I can only get a polygon to paint, the others don't appear on the map. Additionally, if you override the layer styling, so really weird things start to happen and the map doesn't always paint the general geography. Coordinates/points will still appear, but neither the polygons or base map will.

Any suggestions or help from ReTool? ilsemaj, did you make any headway with this after posting your original issue late last year?

Hi @SmartAlex! How are things going with your Mapbox? If you're still blocked here, would you be able to share some screenshots of what you're seeing? In the meantime, I'm hoping this example is helpful:


Is there a doc somewhere on how to override properly? I've attempted to set my featureCollection with marker-colors and other parameters and none of it is showing up in my mapview. I think I will need to override it in the layer styling that you've pointed out but I'm unsure what I should input here.

Unfortunately, right now, the Map component only allows you to style a single layer using the "GeoJSON Layer Styling" input. As a result, applying styles to multiple feature types is not possible.

As for marker colors, I believe that the markers are separate from the layer specified in the "GeoJSON" input field, so you are not able to style them :/

At this time, it may be better to use a custom component if you need more styling options on your map 😞

1 Like

Thanks for the reply @mark !

👍 Sorry I did not have better news. I can definitely update here if/when the Map component is able to support more styling options.

I have tried exactly what you described @Tess, as static points as well as an array of points from our database. I only get them to paint about one time when doing it statically, and that happens when you change the 'type' LineString to something else, and then back again.

Below is an example of a dynamic points list vs typing in exactly what you sent me, generated from:

{
"type": "FeatureCollection",
"features":[
{
"type":"Feature",
"properties":{},
"geometry":{
"type":"LineString",
"coordinates":
{{tripWaypoints.data.coordinates}}
}
}
]
}

{"type":"FeatureCollection","features":[{"type":"Feature","properties":{},"geometry":{"type":"LineString","coordinates":[[48.062315,8.469048333333333],[48.062311666666666,8.468536666666667],[48.062185,8.467893333333333],[48.06254666666667,8.467725],[48.06296666666667,8.467591666666667],[48.06427333333333,8.466678333333334],[48.06453333333333,8.466451666666666],[48.065905,8.465195],[48.066316666666665,8.464748333333333],[48.06543666666666,8.462165],[48.065378333333335,8.461561666666666],[48.065715,8.460428333333333],[48.06590333333333,8.459748333333334],[48.0661,8.45905],[48.066291666666665,8.458361666666667],[48.066545,8.456615],[48.06659666666667,8.456073333333332],[48.066825,8.453975],[48.06695833333333,8.453225],[48.06778666666666,8.451133333333333],[48.06796833333333,8.45078],[48.068468333333335,8.45021],[48.061681666666665,8.468943333333334],[48.06187333333333,8.46899],[48.06339666666667,8.4674],[48.06384,8.467046666666667],[48.065083333333334,8.465968333333333],[48.065486666666665,8.465616666666667],[48.06621,8.464101666666666],[48.065826666666666,8.463161666666666],[48.065533333333335,8.461293333333334],[48.06557333333333,8.461091666666666],[48.06633333333333,8.457705],[48.066428333333334,8.457215],[48.066665,8.455336666666666],[48.066741666666665,8.454658333333333],[48.06713666666667,8.452511666666666],[48.06747,8.451988333333333],[48.06833,8.450521666666667],[48.06847166666667,8.450176666666668]]}}]}

And a screenshot of the same including the layer styling you suggested

I sincerely appreciate your assistance.

Hi @SmartAlex !

I was able to get this to render by switching the feature type to 'Polygon' and then apply the line styling in the Layer Styling input.


Are you able to give this a try?

Hi Ben, thanks for your post.

Coincidentally, after building out a new MDS and GBFS feed for the same client, it occurred to me that the coordinate system in GeoJSON is longitude first then latitude, the reverse of the coordinate entry order on the map component in Retool AND the way most of us are accustomed to entering coordinates in other systems.

I had them reversed in my dynamic list from DB and so the linestrings were probably being painted, just not where the same trip points were on the map in my view, but elsewhere in the world.

It still behaves a little erratically when loading the linestrings every now and again, but it is good enough for my purposes to illustrate the trip route and whether there was significant GPS drift experienced.

Thanks so much for all the help!

Hi everyone,
I found this post quite interesting since I am trying to implement a Mapbox Component in one of my Apps too. In my case, I want to fill features (polygons) with color depending on what value their properties have. Is there any way to do so? I will share what I have tried so far:

but changing the fill color does not seem to work for dynamic "einwohner" values

Hi @Leon !

You should be able to apply conditional filtering using the 'step' option in the Layer Styling. Quick example:

Using the sample data provided in the Map template app: https://raw.githubusercontent.com/PublicaMundi/MappingAPI/master/data/geojson/us-states.json

We can conditionally fill the polygons based on the 'density' field using Layer Styling. This creates different buckets of polygons and fills them with different colors based on which bucket it falls into.

{ "paint": { "fill-color": [ "step", ["get", "density"], "#ffeda0", 10, "#ffeda0", 20, "#fed976", 50, "#feb24c", 100, "#fd8d3c", 200, "#fc4e2a", 500, "#e31a1c", 750, "hsl(348, 100%, 37%)", 1000, "#bd0026" ] } }

Have a look at this example and let us know if that helps solve your problem!

Ben

1 Like

Hey @ben , this works like a charm! Thank you

Does this only work for fill-color or can it also be applied to line-color?

Because the following does not seem to work:

{
  "type": "line",
  "paint": {
    "line-width": 2,
    "line-color": [
      "step",
      [
        "get",
        "style"
      ],
      "#333333",
      0,
      "#ff9900",
      1
    ]
  }
}

Setting it to a fixed value, does work:

{
  "type": "line",
  "paint": {
    "line-width": 2,
    "line-color": "#000000"
  }
}

geojson: https://gist.githubusercontent.com/basvankuijck/d02c73f85184953cc65cc975eaac44d4/raw/697197f475711ba5da6a23d671515f0758379333/gistfile1.txt

Or am I doing something wrong?

:wave: @UnlockAgency can you try testing with the following?

"line-color": [
      "step",
      [
        "get",
        "style"
      ],
      "#333333",
      1,
      "#ff9900",
    ]

Per the mapbox docs, the step function expects to see stop_output_0, stop_input_1, stop_output_1, ..., stop_input_n, stop_output_n where stop_output_i represents the color that's returned when style is less than stop_input_i+1.

Ah that did the job. Probably missed that part of the docs.
Thanks a bunch!