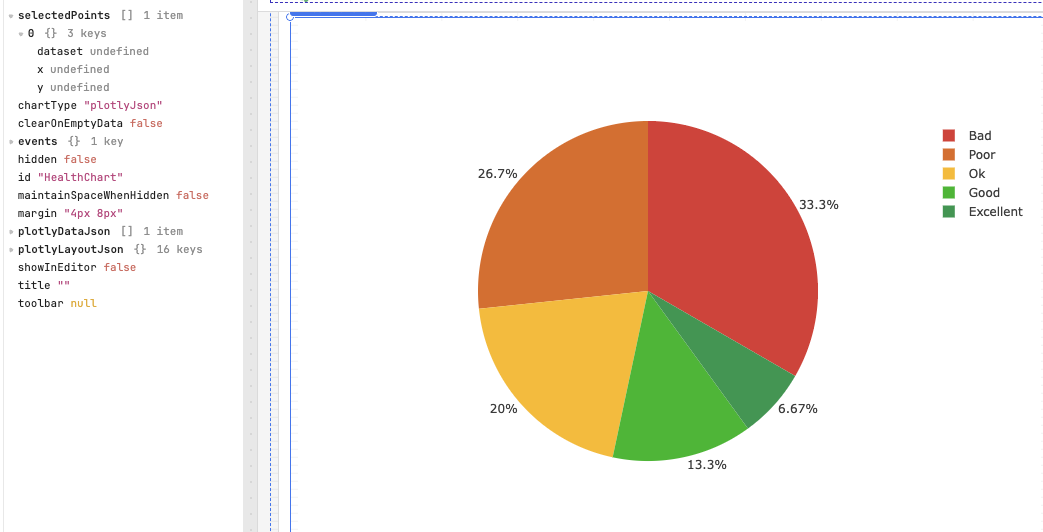
Goal: When using a chart type plotlyJson in my case pie chart, the state property selectedPoints should be set when a click event is received, as the other out of the box charts correctly do.
Select a section of the chart and notice selectedPoints does not update. or it updates by dataset, x and y are undefined.
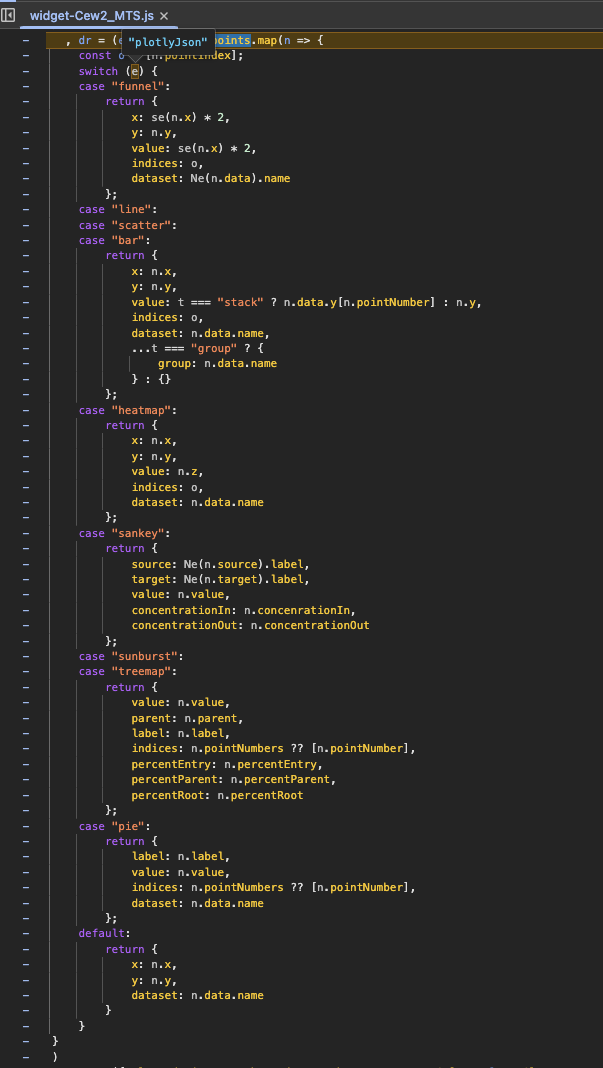
Details: If you follow the setSelectedPoints() function you can see its passing in chartType of plotlyJson but the function that processes the event appears to only deal with the default chart types and doesn't get the underlying chart type when its a plotlyJson chart so the processing doesn't set the correct values on click.
Just reproduced that bug, apologies for the odd behvior on the component. It is fairly new so we appreciate the bug find so we can fix it to improve the component!
Thank you for the patients and will update you with any news I hear on the bug ticket.
Any updates on this?
Would really love a way to use the select event on custom plotlyJson charts, as they are far more customizable than the built-in options.
Thanks @TrevKillick for highlighting this Plotly bug.
+1 from me as well.
It would be great to see this issue addressed, as it affects chart usability and can cause confusion for end users. Fixing it would definitely improve the overall reliability of Plotly components in Retool.