Bug in HeatMap chart?

Hi,

I want to show the usage of horses per day with an heatmap chart.
I created an SQL query getting me the right data :


WITH date_series AS (
    -- Génère les 7 derniers jours à partir d'aujourd'hui sans utiliser generate_series
SELECT ({{ selectedDate.value }}::date - 6) AS jour
    UNION SELECT ({{ selectedDate.value }}::date - 5)
    UNION SELECT ({{ selectedDate.value }}::date - 4)
    UNION SELECT ({{ selectedDate.value }}::date - 3)
    UNION SELECT ({{ selectedDate.value }}::date - 2)
    UNION SELECT ({{ selectedDate.value }}::date - 1)
    UNION SELECT {{ selectedDate.value }}::date
),
  
chevaux_actifs AS (
    -- Sélectionne tous les chevaux (optionnellement filtrer sur Actif = 'Oui' si nécessaire)
    SELECT "Chevaux"."id", "Chevaux"."Nom" as Nom
    FROM "Chevaux"
    WHERE "Actif" = 'oui'
    AND "id" != 45
    AND "id" != 50
),
  
cours_par_cheval_jour AS (
    -- Compte les cours par cheval et par jour
SELECT 
  "Chevaux"."id" AS id_cheval,
  "Chevaux"."Nom" AS nom_cheval,
  "Cours"."Date" AS jour,
  COUNT(DISTINCT "Cours"."id") AS nombre_cours
FROM "Chevaux"
  INNER JOIN "Montoirs" ON "Chevaux"."id" = "Montoirs"."Monture"
  INNER JOIN "Cours" ON "Montoirs"."id_cours" = "Cours"."id"
WHERE "Cours"."Date" >= ({{ selectedDate.value }}::date - 6)
AND "Cours"."Date" <= {{ selectedDate.value }}::date
GROUP BY "Chevaux"."id", "Chevaux"."Nom", "Cours"."Date"
)

-- Produit cartésien entre tous les chevaux et tous les jours
-- Avec LEFT JOIN pour inclure les jours sans cours
SELECT 
    chevaux_actifs.id AS id_cheval,
    chevaux_actifs.Nom AS nom_cheval,
    date_series.jour,
    COALESCE(cours_par_cheval_jour.nombre_cours, 0) AS nombre_cours
FROM 
    chevaux_actifs
CROSS JOIN 
    date_series
LEFT JOIN 
    cours_par_cheval_jour ON chevaux_actifs.id = cours_par_cheval_jour.id_cheval AND date_series.jour = cours_par_cheval_jour.jour
ORDER BY 
    chevaux_actifs.Nom DESC, date_series.jour;

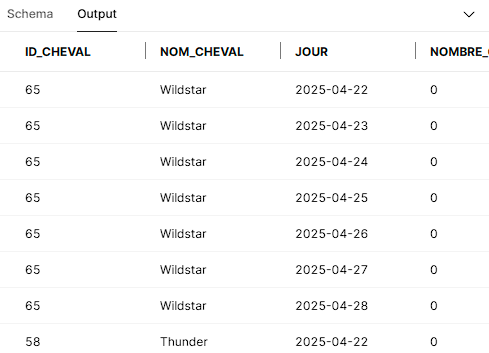
I got this and validate result is good :

But in the heatmap data does not show as expected :

Here is how I setup parameters :

I don't understand what's wrong. Wildstar should be at 0 for all dates.

Hi @Eric_Melka,

I can indeed create a demo using dummy data similar to yours and apply the same GET query to attempt to reproduce the issue. However, this doesn't resolve the underlying problem—it appears to be either a bug within the heatmap component or a data caching issue.

The heatmap in Retool seems to be misinterpreting or incorrectly rendering the data.

Tagging the Retool team for visibility: @Jack_T @Tess — could you please look at this issue?

Thanks!

1 Like

I can provide the database schema and content to test if required. @Jack_T @Tess
When I change the order by in the query it changes the numbers but it should not in my opinion, it should just change the order of names.

In power BI with same SQL request it works well :

Same data in Retool :

No news ? :slight_smile:

Hi @Eric_Melka,

Looking at the sample data in a brand new heatmap component, it looks like values should be an array with nested arrays of data for each horse. If you're passing in a single, non-nested array, I think that might be the issue here.

Here's an example with this dummy data:

Chart:

Values is:
{{ _.uniq(query1.data.NOM_CHEVAL).map(name => query1.data.NOMBRE_.filter((x, i) => query1.data.NOM_CHEVAL[i] === name)) }}

Let me know if something like this works with your full data :crossed_fingers:

Will give it a try tomorrow, thx !

1 Like

Here is the situation.
My SQL query is getHistoMontureDay.

Output of console.log(getHistoMontureDay.data);
image

My heatmap content parameters :

Values formula :
{{ _.uniq(getHistoMontureDay.data.nom_cheval).map(name => getHistoMontureDay.data.nombre_cours.filter((x, i) => getHistoMontureDay.data.nom_cheval[i] === name)) }}

Result of the value formula (just the 2 first array to simplify) :

[
  [
    "0",
    "0",
    "0",
    "0",
    "0",
    "0",
    "0"
  ],
  [
    "0",
    "1",
    "0",
    "0",
    "0",
    "0",
    "1"
  ]
]

Result of Y formula (again just the 2 first entries to simplify) :

[
  "Wildstar",
  "Twilight Truffle"
]

Result in X field :

[
  "2025-05-11",
  "2025-05-12",
  "2025-05-13",
  "2025-05-14",
  "2025-05-15",
  "2025-05-16",
  "2025-05-17",
  "2025-05-11",
  "2025-05-12",
  "2025-05-13",
  "2025-05-14",
  "2025-05-15",
  "2025-05-16",
  "2025-05-17"
]

Data seems to be all good as requested but visual is really weird, it's like it aggregate horse name by the number of unique date.

If I select just 7 unique horses for 7 unique date in my select it is working well :

but with the 34 horses for 7 days it's showing like in the picture :